Aviation under the COVID-19 pandemic: A synopsis from normalcy to chaos and back
Xiaoqian Sun[1], Sebastian Wandelt[1] and Anming Zhang[2] [1]National Key Laboratory of CNS/ATM, School of Electronic and Information Engineering, Beihang University, Beijing, China [2]Sauder School of Business, University of British Columbia, Vancouver, BC, Canada
Abstract: Since the outbreak of the COVID-19 pandemic early in the year 2020, the aviation system has been under extreme pressure for more than two years, with many stakeholders anticipating the moment of recovery. In Summer 2022, eventually, many airlines reached profit margins again. Several airlines even reported to outperform pre-pandemic indicators, including the number of passengers and quarterly revenues. Accordingly, one could say that 2022 is part of the new normalcy in our global aviation system. In this study, we investigate the changes in the global aviation, comparing the year 2019 as a pre-pandemic baseline with the aviation system throughout the year 2022. The connectivity of nearly 8,000 cities worldwide is compared and underlying drivers identified through the design of adequate econometric models. We find that the largest extent of recovery has taken place in secondary cities. We find a rather heterogeneous spatial recovery pattern, which indicates the necessity to better understand the differences in the current aviation system. Moreover, changes of global connectivity indicators, e.g., betweenness centrality, seem to be of rather complex nature. Our study contributes towards a better understanding of the post-pandemic global aviation system and concludes with a set of future research directions, which can hopefully guide other researchers to identify open challenges for the new normalcy.
Keywords:COVID-19 pandemic;Aviation;Review;Data-driven analysis Citation:Sun, X., Wandelt, S., and Zhang, A. (2023). Aviation under the COVID-19 pandemic: A synopsis from normalcy to chaos and back. Journal of the Air Transport Research Society 1(1): 136-151 DOI:https://dx.doi.org/10.59521/8F3EEB54038C692E Download:PDF
1 Introduction
After a decades-long steady growth, the aviation system came to an
almost complete halt in the year 2020 due to the outbreak of the
COVID-19 pandemic. The ramifications and implications of the pandemic
and the aviation system has been rather well documented in the existing
literature, see (Abu-Rayash
and Dincer 2020; Sun et al. 2021; Shortall, Mouter, and Van Wee 2022;
Sun, Wandelt, and Zhang 2022) for recent surveys on the subject.
Throughout the pandemic, many stakeholders have expressed the desire to
return to normalcy as soon as possible, while researchers have pointed
out the huge potential for renewal of the aviation system (Budd,
Ison, and Adrienne 2020; Macilree and Duval 2020; Serrano and Kazda
2020; Linden 2021; Tisdall, Zhang, and Zhang 2021; Sun, Wandelt, and
Zhang 2021; Dube, Nhamo, and Chikodzi 2021; Dube 2022; Rizzi,
Tettamanti, and Rizzi 2022). Throughout the year 2021, while
aviation was still largely impacted by the COVID-19 pandemic,
particularly flight bans and uncertain demands, massive vaccine
roll-outs took place with doses delivered and administered across
continents. The roll-out came with significant inequities, e.g., almost
85% of vaccines had been administered in high- and upper-middle-income
countries at that time1. Towards the end of 2021, many
populations with strong travel desires and histories had been
successfully vaccinated. Accordingly, throughout the year 2022, the
global aviation system saw an impressive return. Various stakeholders
returned to profits in the first half of 2022 and some airlines even
reportedly outperforming pre-pandemic passenger and revenue records.
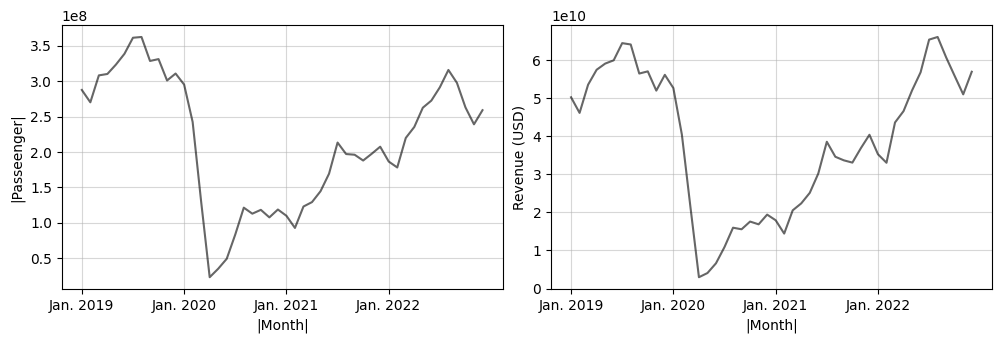
Figure 1 visualizes this
return to (new) normalcy with two time series, highlighting the monthly
evolution of passenger numbers (left) and airline revenues (right)
throughout the period from January 2019 to December 2022. For the year
2019, we can see a strong seasonal development, with peaks of passengers
and revenue being located around July. In April 2020, shortly after the
World Health Organization declared COVID-19 a pandemic, the global
aviation system came to a standstill. Afterwards, the system underwent
several gradual recovery steps, most visible in plateaus following the
Summer peak in 2020 and 2021, respectively. Finally, in the year 2022,
we can see a similar highly seasonal signal as in the year 2019.
Overall, it can be seen that - at the global scale - the number of
passengers is still lacking behind about 15% compared to the
pre-pandemic reference from the year 2019. The total revenues (in USD)
have already reached pre-pandemic levels in the year. Accordingly, the
year 2022 can be considered the first year back to normalcy, following
the COVID-19-induced chaos. The extent to which the subsystems are
recovered, and the existence of heterogeneities and their drivers are
yet to be explored in the scientific literature, given that existing
studies have largely focused on describing the singleton-like impact of
the pandemic on the system, throughout the years 2020 and 2021.
Figure 1: Evolution of global airlines passengers (left) and
revenue (right) for the years 2019 to 2022.
In this study, we investigate the difference of the global aviation
system, comparing pre-pandemic status and new normalcy. The former
period is represented by data for the year 2019 and the latter by data
for the year 2022. Specifically, we are interested in the analysis of a
geographical and connectivity-based perspective, which emphasizes the
roles of worldwide cities (and their changes) in the focus of interest.
We think that the role of cities has been under-explored in the exiting
literature, focusing very much on the role of individual airports or
groups thereof. Moreover, the emphasis on cities hides the role of
individual airport’s success/failure strategies in multiple airport
regions, focusing rather on the development of cities and regions. Our
study analyzes the evolution of 7,996 cities worldwide in terms of three
indicators: the number of departures, the local connectivity in terms of
degree centrality, and the global connectivity in terms of betweenness
centrality. In addition to analyzing the properties of specific cities,
we further zoom into the role of specific markets (city pairs) and see
which ones have recovered, rather well throughout the year 2022. For
each analysis, we have designed an appropriate econometric model, which
explains the changes in connectivity through a range of explanatory
variables related to city size, geographical factors, and development
indicators. Using Ordinary Least Squares regression, we identify a
subset of significant variables and describe how these are possibly
related to the observed recovery status.
The remainder of this study is structured as follows. Section 2 summarizes the existing
literature on the subject, with a strong focus on studies concerned with
COVID-19 and aviation. Section 3 introduces
the analysis methodology / data and provides the description of various
analysis experiments for the recovery of worldwide cities in the year
2022. Section 4 summarizes the findings in this
study, provides an overview on relevant policy implications, and
suggests a set of interesting directions for future work.
2 Literature Review
In this section, we review the extant literature on city connectivity
and aviation during the COVID-19 pandemic. The latter topic, however,
has caused what could be best described as a hurricane to the aviation
literature and accordingly we refer readers for more details to
specialized surveys, e.g., (Abu-Rayash
and Dincer 2020; Sun et al. 2021; Shortall, Mouter, and Van Wee 2022;
Sun, Wandelt, and Zhang 2022). Section 2.1 summarizes existing
studies which have investigated the connectivity of airports and cities
with a focus on pre-pandemic time periods. Section 2.2 provides a broad
overview on studies that have discussed the early impact of COVID-19 on
the global aviation system. Section 2.3 discusses extant work
which focused on the early and late recovery phase of aviation from the
pandemic impacts. Section 2.4 summarizes our main
novel contributions considering the established state of the art.
2.1 Pre-pandemic connectivity
analysis
(Guimera and
Amaral 2004) was among the first to develop a model for the
worldwide airport. This model is based on the notion of complex
networks, where nodes represent airports and links represent direct
flights between airports. Various statistical properties have been
analyzed, including the node degree distributions, network
classification based on shortest path lengths, and the resilience of
such systems. The number of similar follow-up studies is tremendous,
especially when including the analysis of sub-networks. Accordingly, we
refer the interested read to a empirical survey which compares various
network snapshots concerning time and space domain, deriving a set of
unifying properties, see (Wandelt, Sun, and Zhang 2019).
Another related work on airports, but with a much stronger focus on
connectivity, was conducted by (Cheung, Wong, and Zhang 2020).
The authors proposed a set of five centrality indicators, coined the
Global Airport Connectivity Index (GACI), in order to identify
connectivity positions and development paths of airports in the global
aviation system. It is shown that an increased GACI is an indicator for
improved airport connectivity. While much of the related work in the
literature focuses on individual airports, various aggregation schemes
can be implemented for an improved analysis. The most natural
aggregation in the aviation domain is presumably a so-called
multiple-airport region, in which airports within a specific (spatial or
temporal) distance are treated as a single entity. Beyond that, there is
wide range of possible aggregations and fractality analysis, see (Sun, Wandelt, and Zanin
2017) for an overview. Cities maybe the most natural adaption of
multiple-airport regions, by focusing less on the competition of
airports and more on the location of populations agglomerations. (Derudder and Witlox
2016) provided a comprehensive overview and highlighted that
diverse connectivity through aviation is a vital component for the
development of major cities’ economies, mainly due to the fast access to
markets and entities. Accordingly, the analysis of aviation city
networks has gained an increased interest in recent years. (Fan 2006)
analyzed the evolution and improvements of inter-city flight
connectivity in Europe for the period 1996–2004. (Suau-Sanchez, Voltes-Dorta, and
Rodrı́guez-Déniz 2016) reported in the dependence of a city and
its neighborhood on selected airports within the catchment area and how
bypassing some of these airports can lead to new market opportunities.
(Wang et al.
2020) analyzed the evolution of major city clusters in China, in
presence of rail connectivity. (Sun, Wandelt, and Zhang 2020b)
investigated the resilience of the global aviation city network under
various disruption scenarios.
2.2 COVID-19 Phase 1: Unprecedented
Shock
Concerning the first phase with COVID-19, which can be best described
as the period from January 2020 to May 2020, a set of studies have been
published which reported on the direct impact of COVID-19 on aviation.
These studies have mostly focused on the excessive reduction in demand /
mobility and sometimes provided an outlook based on possible future
travel scenarios. Reviewing all these extant works is beyond the scope
of this study; we refer to a few selected and influential papers only.
(Abu-Rayash and
Dincer 2020) analyzed the effect of COVID-19 on global mobility
trends, with an emphasis aviation and travel in selected cities. (Nhamo et al.
2020), based on a network representation of global airports,
identified negative impact of the pandemic on airport operations and
revenue streams, raising concerns for an increased financial support of
the aviation system and its stakeholders. (Abu-Rayash and Dincer 2020)
developed and evaluated a mobility index in the context of
COVID-19-impact. In addition, the authors provide several complementary
statistics at the city level for selected cities in the world. (Suau-Sanchez, Voltes-Dorta,
and Cugueró-Escofet 2020) investigated the evolution of various
economic aviation indicators, specifically focusing on airline revenues,
and discussed the relationship to air travel restrictions gradually
implemented throughout the year 2020. (Iacus et al. 2020) reported on
the significantly reduced passenger numbers during the early phase with
COVID-19 and suggested various projections on the future passenger
demands and the socio-economic impact of the pandemic. (Sun, Wandelt, and Zhang
2020a) took the complex network representation of the worldwide
airport system and investigated how various indicators changed during
the first few months of the COVID-19 pandemic. It was found that all
indicators underwent strong fluctuations, indicating the instability of
the overall system at that time. (Chu et al. 2020) analyzed the
impact of implemented travel restrictions in Latin America through the
means of network connectedness, highlighting the importance of timely
air travel restrictions, especially in cities and countries which serve
as air transportation hubs. A few studies were more generic by their
research question. For instance, (Nižetić 2020) performed a wider
case study on the early impact of COVID-19, including effects on air
transport, the energy sector, and the environment. Similarly, (Mhalla 2020)
investigated the early impact of COVID-19 on the global oil and aviation
markets.
2.3 COVID-19 Phase 2: Recovery and
endemic normality
Research on the recovery of aviation is much scarcer than work on the
negative impact. We discuss the relevant studies for air transportation
recovery below. (Sharma
2021) used an agent-based model and developed a simulation of
different recovery patterns. It was found that injecting money into the
system at various places is likely to mitigate some of the negative
impacts. (Michelmann
et al. 2022) developed three scenarios for aviation recovery,
including interactions among economic, environmental, and pandemic
factors, emphasizing the need to anticipate plausible development paths
early. (Gudmundsson,
Cattaneo, and Redondi 2021) proposed a forecasting model based on
auto regressive integrated moving average, highlighting different
recovery scenarios. Overall, recovery times around two years were
anticipated, with air freight recovering slightly faster than passenger
air transport. (Hanson et
al. 2022) used two distinct elasticity models to predict the
recovery of aviation inside the United States, predicting a recovery in
the year 2022. (Kaffash
and Khezrimotlagh 2022) provided a comparison of recovery
developments between full-service carriers and low-cost carriers,
identifying trade-offs between efficiency and cancellations / flight
reductions.
2.4 Major contributions of our
study
Various extant studies have evaluated the connectivity of airports
and cities before the onset of COVID-19 (Section 2.1). During the
COVID-19 pandemic, existing studies have put a strong focus on the
dissection of impacts according to various indicators (Section 2.2) derived a set
of predictive models in order to forecast recovery periods of the global
aviation system and its subsystems (Section 2.3). In this study, we
make the following major contributions:
We perform a data-driven analysis of the aviation system recovery
from COVID-19 at the city level, comparing selected connectivity
indicators of the year 2019 with the year 2022. These connectivity
indicators include the number of departures as well as local network
connectivity (degree) and global network connectivity
(betweenness).
The connectivity indicators are evaluated for two types of
entities. First, we identify the importance of nearly 8,000 individual
cities (and changes thereof) in the global aviation system. Second, we
also look at specific markets (city pairs) and see how their
connectivity has changed in the recovery compared to pre-pandemic
levels.
The experiments in our study are not only performed by visual
exploration, but we also develop a set of econometric models which aim
to explain the underlying changes in connectivity at the city and market
level. Through ordinary least squares regression, we identify a set of
key variables which are significant for explaining system
changes.
3 Data-driven analysis between 2019
and 2022
3.1 Preliminaries
The aviation-related data used in our study is from Sabre AirVision
Market Intelligence2, an aviation passenger flow analysis
system for the collection and dissemination of historical passenger
booking data, among others. The Sabre database contains comprehensive
data items, including schedules and ticket data with origin,
destination, intermediate stops, and fare data. For the purpose of this
study, we have used data at city level, airports have been assigned to
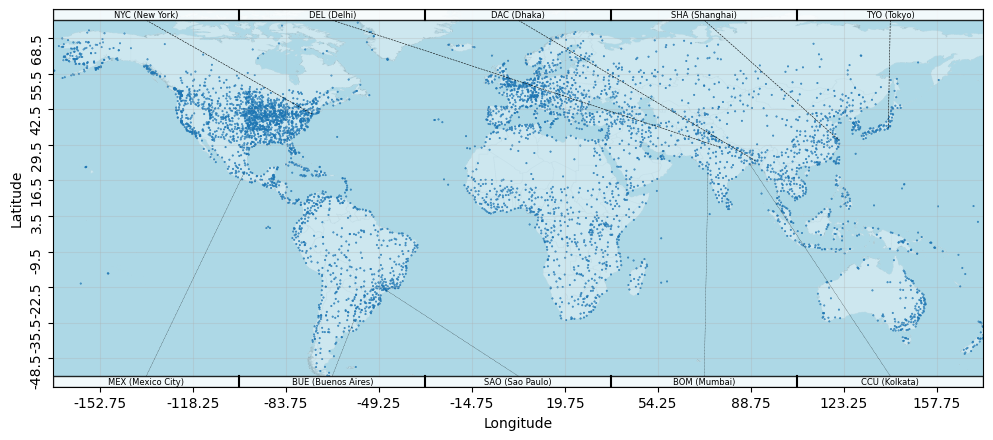
each city using the methodology proposed in (Sun et al. 2017). Figure 2 provides an overview on
the cities in our study. In total, we have 7,996 cities across all
continents. The top-10 cities according to population size (data for the
year 2019) are highlighted with name and three-digit city code. A list
of all cities referenced in our manuscript and their abbreviations
mentioned in this study are provided in Table 6.
Figure 2: Overview on 7,996 cities in our study.
Throughout this study, we make use of a few connectivity indicators
as defined below. Let G = (N,E) be a
network with nodes N and a set
of edges E. The degree
centrality of a node n ∈ N is defined as: deg(n)=(|{(x,y) Î E | x=n Ú y=n}|)/(N) The betweenness centrality of a node n ∈ N is defined as: betw(n)=å_(i,j) Î N× N, i\nej\nen
(s_ij(n)s_ij , where σij
represents the number of shortest paths from i to j and σij(v)
is the number of shortest paths that go through v from i to j. The betweenness centrality of an
edge (n,m) ∈ E is
defined as: edgebetw(m,n)=å_i,j Î N× N, i\nej
(s_ij(m,n)s_ij , where σij
represents the number of shortest paths from i to j and σij(m,n)
is the number of shortest paths that go through edge (m,n) from i to j.
3.2 Analysis of global city
connectivity changes
The following variables are used for regression analysis:
POPc:
The total population of a city c in the year 2019. This variable is
log-scaled.
CAPc:
Whether a city c is a capital
city (1.0) or not (0.0).
DNSc:
The population density of a city c in the year 2019. This variable is
log-scaled.
APSc:
The number of airports associated to a city c in the year 2019; based on
inter-airport temporal distances multiple-airport regions defined
by (Sun et al.
2017). This variable is log-scaled.
HDIc:
The Human Development Index in the year 2019 of the country city c belongs to. Value 1.0 represents
very high / high and value 0.0 represents Low
/ very low.
CHNc:
A dummy variable indicating whether city c is located in China (1.0) or not
(0.0).
INDc:
A dummy variable indicating whether city c is located in India (1.0) or not
(0.0).
ASc:
A dummy variable indicating whether city c is located in Asia (1.0) or not
(0.0).
EUc:
A dummy variable indicating whether city c is located in Europe (1.0) or not
(0.0).
AMc:
A dummy variable indicating whether city c is located in Americas, including
North America and South America, (1.0) or not (0.0).
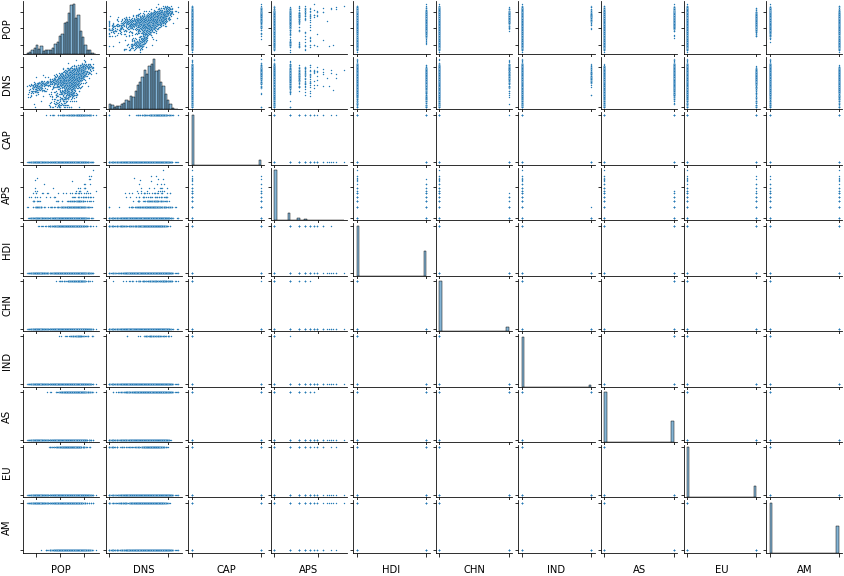
In Figure 3,
we visually report an overview on the extent of correlation between the
variables in our study. While several variables are binary in our study,
we cannot observe a strong correlation between either pair of
variables.
Figure 3: Pairwise correlation between city-level regression
variables in this study.
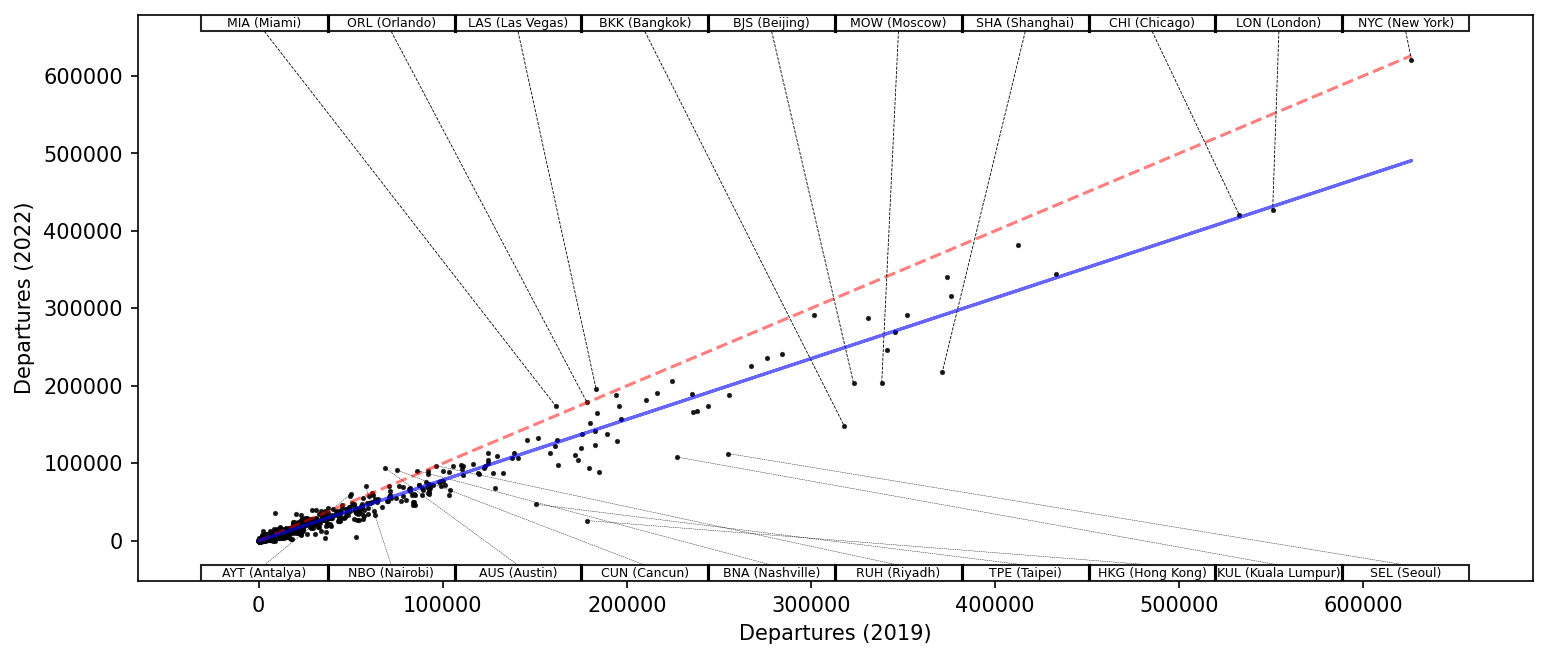
Figure 4 visualizes the
correlation between departures of each city concerning the years 2019
(x-axis) and 2022 (y-axis). Cities which have an unchanged number of
departures can be found along the diagonal (red, dashed) line. The best
linear fit for the city departure data is visualized with a blue solid
line. Several selected cities are highlighted with their city codes and
names, based on their distance from the diagonal line, highlighting
interesting cases. Overall, the number of departures in 2022 is still
smaller than in 2019 for most cities, also indicated by the slope and
intercept of the blue line, compared to the diagonal. The two cities
with the largest number of departures and gains in departures are both
located in the United States: Miami (MIA) and Las Vegas (LAS). Both of
these cities have a high domestic attractiveness, particularly in times
of recovery from COVID-19 restrictions. Miami is a popular tourist
destination in Summer / Winter and Las Vegas is infamous for its
gambling industry. Accordingly, we presume that these two cities
successfully recovered due to high domestic tourism interest. In
addition, there is a larger number of cities with less than 100,000
departures per year, which were also able to recover beyond pre-pandemic
levels. New York (NYC) had the largest number of departures in the year
2019 and has recovered nearly to pre-pandemic levels as well. Cities
which are still far away from a complete recovery include Hong Kong
(HKG), Bangkok (BKK), Moscow (MOW), Chicago (CHI), and London (LON).
Figure 4: Scatter plot of city departures comparing 2019 and
2022.
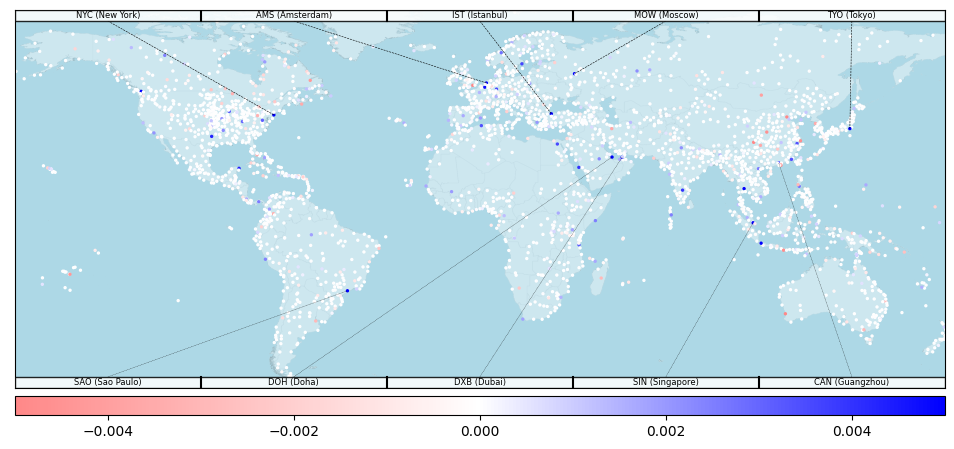
Figure 5 visualizes the
changes in departures on a map, highlighting the extent of changes by
color, from red (reduction of departures) to blue (gains in departures).
It can be seen that the vast number of cities has yet to recover
completely. The locations of recovered cities do not reveal a strong
pattern visually, with cities from major countries in the world being
colored in blue.
Figure 5: Map visualization of city departures comparing
2019 and 2022.
To better understand the drivers behind departure-wise recovery, we
develop a simple regression model. We have computed the Ordinary Least
Squares regarding the following equation with coefficients β1 to β10 and error term ϵ: DEPchangec=b_1*POPc + b_2*CAPc + b_3*DNSc+ b_4*APSc + b_5*HDIc+ b_6*CHNc +
& b_7*INDc+ b_8*ASc+ b_9*EUc+ b_10*AMc+e Table 1 reports the results
of the regression. The regression results were obtained by computation
over all cities, i.e., one overall regression. Note that we have not
clustered standard errors. We can identify seven statistically relevant
variables which contribute to the explanation for departure changes of
cities from 2019 to 2022. A higher population density reduces the
likelihood for a recovery in departures. We believe that this
observation is mainly related to the fact that there are various cities
with a smaller number of departures in 2019 (secondary cities), which
were able to increase their departures - contrary to other major
aviation hubs. Similarly, we find the that capitals have less recovered
in terms of departures, compared to non-capitals, which can presumably
be explained with a similar rationale as DNS. Other
variables with a negative coefficient include APS, HDI, AS and AM, indicating that smaller
cities with less airports from non-Asian and non-American countries
might have a higher likelihood for recovery. Interestingly, IND has a positive
impact on the departure recovery, indicating that Indian cities
recovered rather well, possibly under influence of increased domestic
traffic.
Table 1: Regression results for the change in departures of a city.
coef
std err
t
P>|t|
[0.025
0.975]
Intercept
-0.3454
0.660
-0.524
0.601
-1.639
0.948
POP
0.0047
0.058
0.081
0.936
-0.110
0.119
DNS
-0.1849
0.064
-2.867
0.004**
-0.311
-0.058
CAP
-2.2123
0.425
-5.211
0.000***
-3.045
-1.380
APS
-3.1549
0.279
-11.328
0.000***
-3.701
-2.609
HDI
-0.7747
0.297
-2.605
0.009**
-1.358
-0.191
CHN
-0.8572
0.501
-1.712
0.087
-1.839
0.125
IND
2.8324
0.674
4.204
0.000***
1.511
4.154
AS
-2.4701
0.387
-6.379
0.000***
-3.230
-1.711
EU
-0.1406
0.431
-0.326
0.744
-0.986
0.705
AM
-1.3844
0.354
-3.906
0.000***
-2.079
-0.689
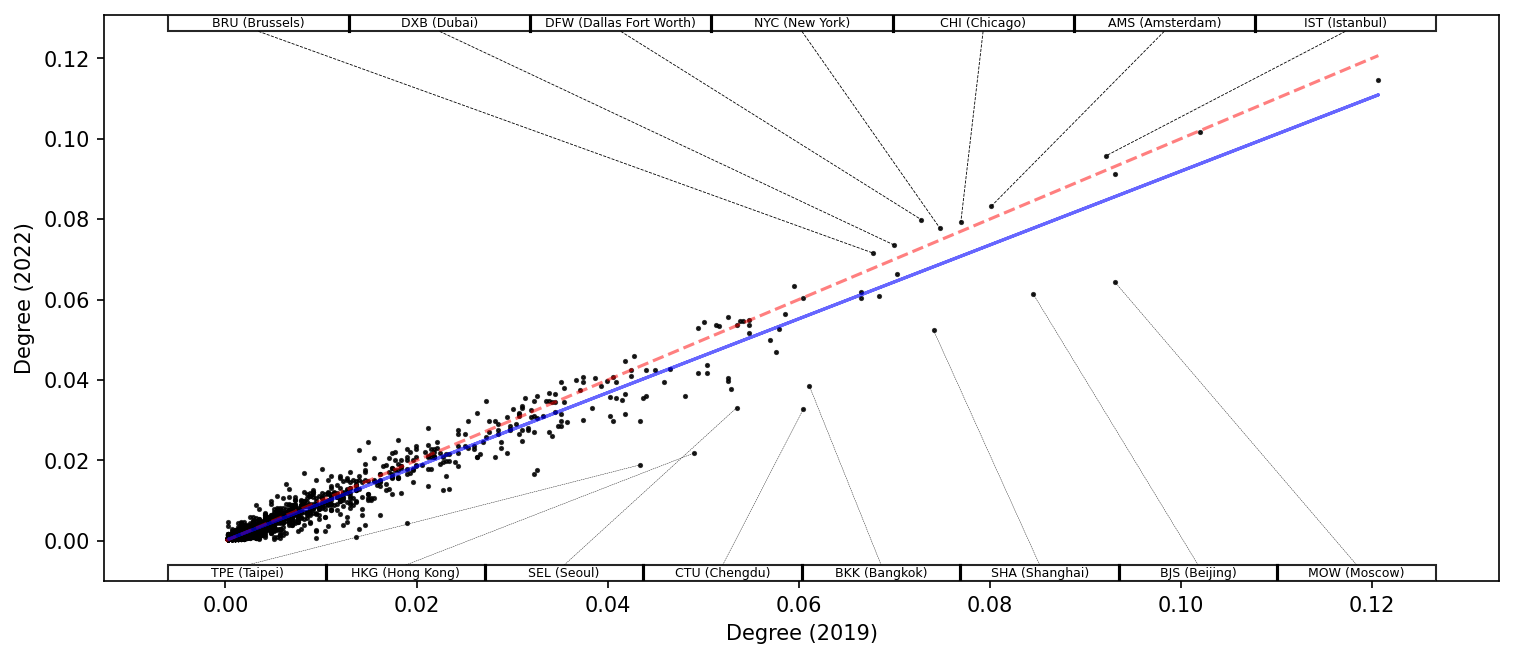
Figure 6 explores on the
evolution of a complex network measure for each city concerning the
years 2019 (x-axis) and 2022 (y-axis): The degree of each city. In
network science, the degree of a node is a local node centrality which
counts the number of neighbors. Accordingly, in our context the degree
measures the number of city destinations which can be reached by direct
flights. The diagonal is indicated by a red, dashed line and the best
linear fit is visualized with a blue solid line. Contrary to the
departures, we can see that the degree of cities seems to have recovered
more, with many of the well-connected cities having achieved or even
outperformed pre-pandemic connectivity. The latter cities can be mostly
found in Europe, North America, and the Middle East. Cities which are
still significantly behind pre-pandemic degrees can be found mostly in
Asia, such as Beijing (BJS), Bangkok (BKK), Seoul (SEL), and Moscow
(MOW).
Figure 6: Scatter plot of city degree centrality comparing
2019 and 2022.
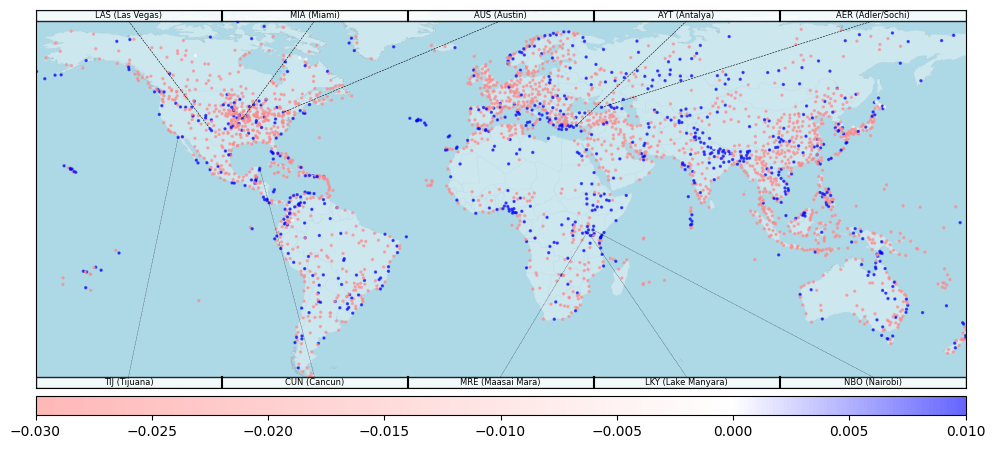
Figure 7 visualizes the
results for the changes in degree centrality (which is the degree
divided by the number of nodes) comparing the year 2019 with 2022. In
line with the observations from Figure 6, we can see that
the majority of cities with an increased degree can be found in the
Northern hemisphere mostly (blue color). However, for most of the cities
we do not find a significant change in degree centrality. The cities
with significant lack of recovery (colored in red) can be found mostly
in Asia and Europe.
Figure 7: Map visualization of city degree centrality
comparing 2019 and 2022.
To better understand the drivers behind degree-wise recovery, we
develop a simple regression model. We have computed the Ordinary Least
Squares regarding the following equation with coefficients β1 to β10 and error term ϵ: DEGchangec=b_1*POPc + b_2*CAPc + b_3*DNSc+ b_4*APSc + b_5*HDIc+ b_6*CHNc +
& b_7*INDc+ b_8*ASc+ b_9*EUc+ b_10*AMc+e Table 2 reports the results
of the regression. The regression results were obtained by computation
over all cities, i.e., one overall regression. Note that we have not
clustered standard errors. We can identify six statistically relevant
variables which contribute to the explanation for degree centrality
changes of cities from 2019 to 2022. Three size-related variables for
cities have again a negative coefficient (POP, CAP, APS), indicating
that the recovery is more prevalent across secondary cities. The
coefficient for China (CHN) is negative
and the coefficient for India (IND) positive,
indicating the complementary evolution of both countries during the
recovery in 2022. Finally, the variable for Asia (AS) have a negative
coefficient as well, highlighting that Asia is lacking behind in
recovery concerning the degree centrality.
Table 2: Regression results for the change in degree centrality of a
city.
coef
std err
t
P>|t|
[0.025
0.975]
Intercept
0.001400
0.000000
5.138
0.000
0.001
0.002000
POP
-0.000081
0.000025
-3.269
0.001***
-0.000
-0.000032
DNS
-0.000062
0.000027
-2.276
0.023
-0.000
-0.000009
CAP
-0.000500
0.000000
-3.008
0.003**
-0.001
-0.000000
APS
-0.001300
0.000000
-10.703
0.000***
-0.001
-0.001000
HDI
-0.000017
0.000000
-0.131
0.896
-0.000
0.000000
CHN
-0.000700
0.000000
-3.076
0.002**
-0.001
-0.000000
IND
0.001500
0.000000
5.226
0.000***
0.001
0.002000
AS
-0.000800
0.000000
-4.866
0.000***
-0.001
-0.000000
EU
0.000200
0.000000
1.171
0.242
-0.000
0.001000
AM
0.000200
0.000000
1.207
0.228
-0.000
0.000000
In Figure 8, we investigate
the relationship among betweenness centrality values of cities. Each
data point corresponds to a city with 2019 betweenness values on the
x-axis and 2022 betweenness values on the y-axis. In network science,
the betweenness of a node is a global node centrality which counts the
number of times a node appears on all-pairs shortest paths in the
network. In our context the betweenness measures the probability that a
random traveler uses a specific city as a hub. The diagonal is indicated
by a red, dashed line and the best linear fit is visualized with a blue
solid line. We can see that the trend line - contrary to the number of
departures and the degree centrality - has a larger slope than the
diagonal line, indicating that cities with a high initial betweenness
(in the year 2019) have a slightly larger growth in betweenness than the
other cities. Some of the betweenness increases are rather significant
(considering the difficulty to change this global network centrality by
local changes only under capacity constraints): Istanbul (IST), Dubai
(DXB), Doha (DOH), and Guangzhou (CAN). These cities are located in the
Middle East / Asia. Other cities gained betweenness centrality values as
well: Amsterdam (AMS), Sao Paolo (SAO), and New York (NYC).
Figure 8: Scatter plot of city betweenness centrality
comparing 2019 and 2022.
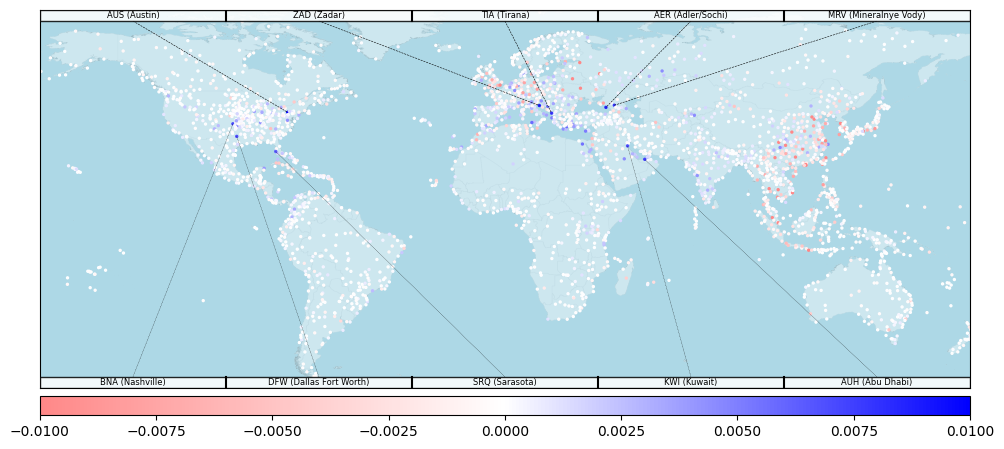
Figure 9 visualizes the
changes in betweenness centrality on a map. We can see that the cities
which gained betweenness centrality are located well distributed on the
map. The cities which have lost betweenness centrality, however, are
mostly located in China: Beijing (BJS), Chengdu (CTU), and Hongkong
(HKG).
Figure 9: Map visualization of city betweenness centrality
comparing 2019 and 2022.
To better understand the drivers behind betweenness-wise recovery, we
develop a simple regression model. We have computed the Ordinary Least
Squares regarding the following equation with coefficients β1 to β10 and error term ϵ: BETWchangec=b_1*POPc + b_2*CAPc + b_3*DNSc+ b_4*APSc + b_5*HDIc+ b_6*CHNc +
& b_7*INDc+ b_8*ASc+ b_9*EUc+ b_10*AMc+e Table 3 reports the
results of the regression. The regression results were obtained by
computation over all cities, i.e., one overall regression. Note that we
have not clustered standard errors. It is striking that we only identify
one statistically significant variable: the number of airports in a city
(APS), which is related slightly positively with the gain in betweenness
centrality. Beyond this, the drivers behind the change are rather
difficult to identify. Moreover, it should be noted that the number of
cities with extreme changes is rather small; most of the cities in
Figure 9 were colored in
white, indicating changes in betweenness centrality are rather
minor.
Table 3: Regression results for the change in betweenness centrality of
a city.
coef
std err
t
P>|t|
[0.025
0.975]
Intercept
-0.000300
0.000000
-1.325
0.185
-0.001000
0.000000
POP
0.000013
0.000022
0.607
0.544
-0.000030
0.000057
DNS
-0.000006
0.000024
-0.262
0.794
-0.000054
0.000042
CAP
0.000200
0.000000
1.442
0.150
-0.000068
0.000000
APS
0.000300
0.000087
3.219
0.001***
0.000000
0.000000
HDI
0.000089
0.000000
0.809
0.419
-0.000000
0.000000
CHN
-0.000300
0.000000
-1.978
0.048
-0.001000
-0.000003
IND
-0.000023
0.000000
-0.103
0.918
-0.000000
0.000000
AS
0.000300
0.000000
2.264
0.024
0.000045
0.001000
EU
0.000064
0.000000
0.395
0.693
-0.000000
0.000000
AM
0.000100
0.000000
0.913
0.362
-0.000000
0.000000
3.3 Analysis of markets
The following variables are used for regression analysis:
GRVc1, c2:
The gravity model-based demand for the two cities c1 and c2 based on population data for the
year 2019: $\frac{p_{c1}*p_{c2}}{d_{c1,c2}}$, where
pc is the
population of city c and dc1, c2
is the Haversine distance between the city centers of c1 and c2. This variable is
log-scaled.
DNSPc1, c2:
Product of population density for the two cities. This variable is
log-scaled.
CAPPc1, c2:
Product of CAPc1
and CAPc2.
CAPMc1, c2:
Maximum of CAPc1
and CAPc2.
DOMc1, c2:
Indicates whether the two cities are located in the same country (1.0)
or not (0.0).
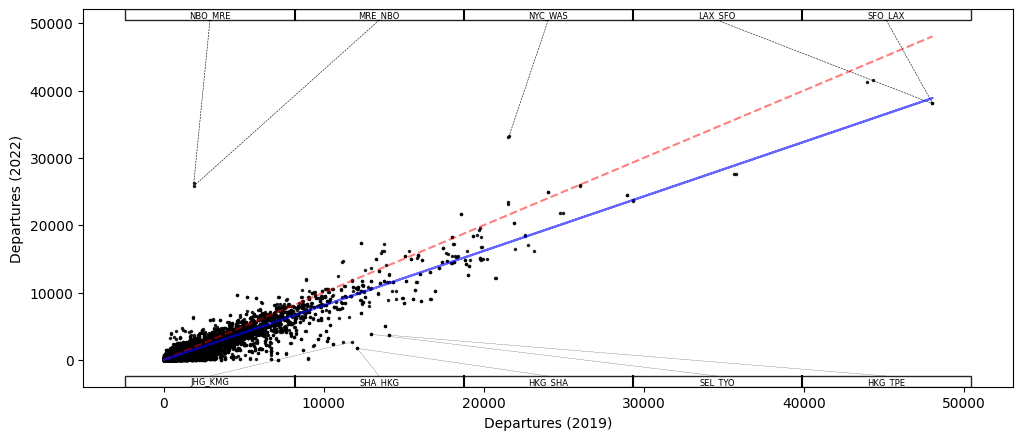
Figure 10 visualizes the
correlation between departures in each market (city pair) concerning the
years 2019 (x-axis) and 2022 (y-axis). Markets which have an unchanged
number of departures can be found along the diagonal (red, dashed) line.
The best linear fit for the city departure data is visualized with a
blue solid line. Well-performing markets are highlighted with their city
codes, please refer to the Appendix (Table 6) for a full list of used
city abbreviations. We can identify a few markets which have recovery to
an outstanding extent - even much beyond pre-pandemic levels: Maasai
Mara (MRE) - Nairobi (NBO) and New York City (NYC) - Washington (WAS).
Apart from that it seems like most markets are on the way of recovering
well. The major exceptions, which are still lagging significantly behind
in terms of departures, are mostly located in South-East Asia.
Figure 10: Scatter plot of market departures comparing 2019
and 2022.
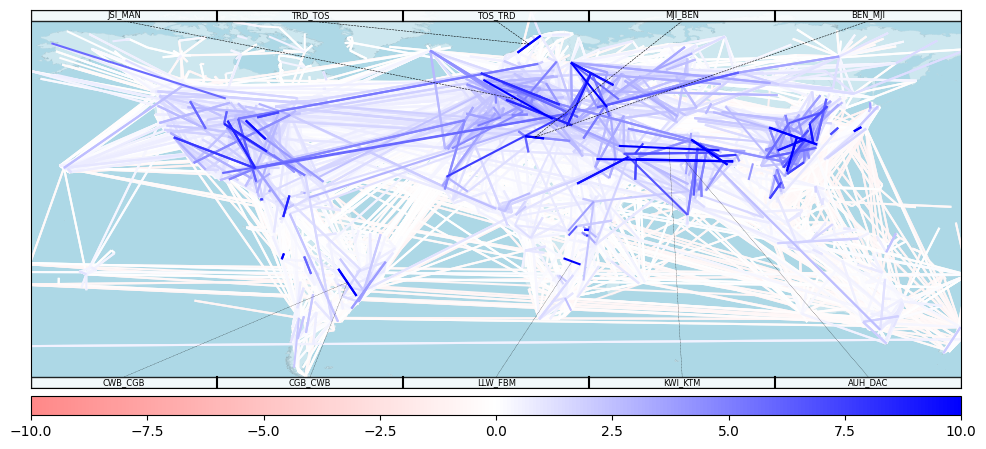
Figure 11 supports the
spatial analysis further, by presenting the city pairs and their
recovery on a map. The outperforming markets can be found mostly inside
the three major aviation regions worldwide: North America, Europe, and
Asia. This confirms earlier findings, that domestic connections have
indeed recovered much faster and more sustainable than the international
counterparts. Nevertheless, we can also identify a few cross-continental
connections, which have exceeded pre-pandemic baselines.
Figure 11: Map visualization of market departures comparing
2019 and 2022.
To better understand the drivers behind departure recovery across
markets, we develop a simple regression model. We have computed the
Ordinary Least Squares regarding the following equation with
coefficients β1 to
β5 and error term
ϵ: DEPchangec1,c2
=b_1*GRVc1,c2
+ b_2*DNSPc1,c2
+ b_3*CAPPc1,c2
+ b_4*CAPMc1,c2
+ b_5*DOMc1,c2
+e Table 4 reports the
results of the regression. The regression results were obtained by
computation over all markets, i.e., one overall regression. We can
identify four statistically significant variables. The only positively
related variable is GRV, meaning that
cities with a higher gravity-induced demand indeed recovery better.
Variable DNSP is negatively related to the departure recovery,
indicating that connections between cities with dense population were
slightly less likely to recover well. The variables with the largest
absolute coefficients are CAPP and
CAPM,
which indicates that connections involving capitals were less likely to
recover well in the year 2022. Finally, it is interesting to note that
variable DOM
is not statistically significant. We presume that this is because some
domestic markets recover rather well (e.g., markets involving tourism
attractions), while other markets did not.
Table 4: Regression results for the change in the number of departures
of a market.
coef
std err
t
P>|t|
[0.025
0.975]
Intercept
0.0691
0.021
3.336
0.001
0.029
0.110
GRV
0.0027
0.001
2.757
0.006**
0.001
0.005
DNSP
-0.0020
0.000
-9.169
0.000***
-0.002
-0.002
CAPP
-0.0623
0.021
-2.955
0.003**
-0.104
-0.021
CAPM
-0.0881
0.013
-6.862
0.000***
-0.113
-0.063
DOM
0.0166
0.012
1.388
0.165
-0.007
0.040
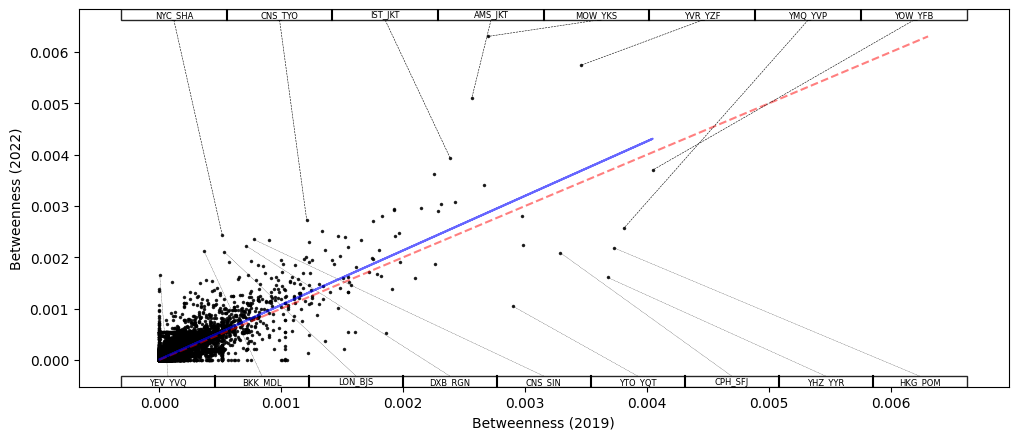
Figure 12 visualizes the
correlation between edge betweenness centrality in each market (city
pair) concerning the years 2019 (x-axis) and 2022 (y-axis). Outstanding
markets are highlighted with their city codes, please again refer to the
Appendix (Table 6)
for a full list of used city abbreviations. The results in this chart
are the most diverse in our study, with many markets having changed
their betweenness between the years 2019 and 2022. It is rather
difficult to get a sense of any underlying patterns and therefore we
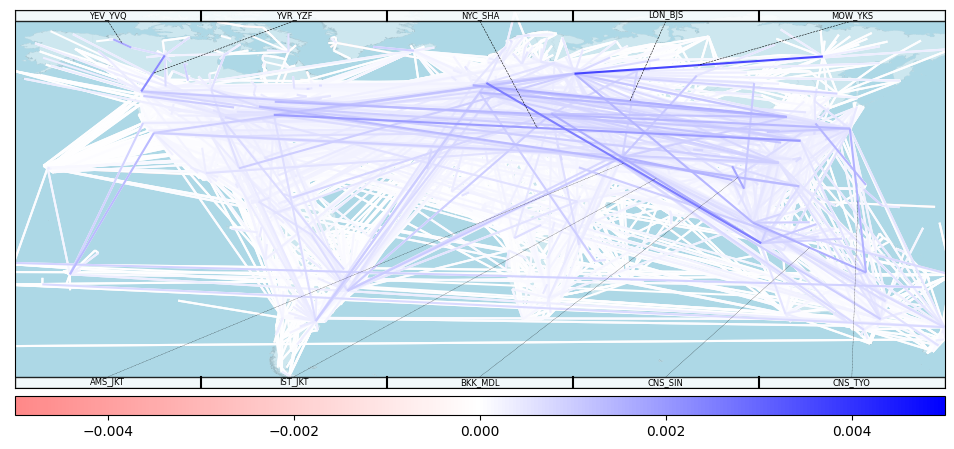
visualize the changes on a map in Figure 13. Many of the
well-performing markets serve exactly one airport in South-East Asia or
Oceania. We conjecture that this observation is due to the loss of
international connectivity for Chinese aviation hubs and also Hong Kong,
due to significantly longer implementations of restrictions against
COVID-19. Accordingly, it seems like not a single new hub is emerging,
but airlines try to provide connections to destinations directly,
without going through one of the popular hubs used earlier. Future
research could aim to further elaborate on this possibility.
Figure 12: Scatter plot of market edge betweenness
centrality comparing 2019 and 2022. Figure 13: Map visualization of market edge betweenness
centrality comparing 2019 and 2022.
In order to understand the drivers behind betweenness recovery across
markets, we develop a simple regression model. We have computed the
Ordinary Least Squares regarding the following equation with
coefficients β1 to
β5 and error term
ϵ: BETWchangec1,c2
=&b_1*GRVc1,c2
+ b_2*DNSPc1,c2
+ b_3*CAPPc1,c2
+ b_4*CAPMc1,c2
+ b_5*DOMc1,c2
+e Table 5 reports the
results of the regression. The regression results were obtained by
computation over all markets, i.e., one overall regression. Our results
reveal two statistically relevant variables, both with a positive
coefficient: GRV and CAPM. Accordingly, markets with a high demand, on
which one of them is a capital, have increased their betweenness
centrality value most. It should be noted that these findings are not in
contradiction with the results for departures above: While markets
involving one or more capitals have lost in departures, then network was
apparently extended by adding (possibly low-frequency) connections
between capitals and secondary cities.
Table 5: Regression results for the change in the edge betweenness
centrality of a market.
coef
std err
t
P>|t|
[0.025
0.975]
Intercept
-8.685000e-06
4.290000e-06
-2.023
0.043
-1.710000e-05
-2.710000e-07
GRV
9.481000e-07
2.300000e-07
4.125
0.000***
4.980000e-07
1.400000e-06
DNSP
1.044000e-07
5.030000e-08
2.076
0.038
5.810000e-09
2.030000e-07
CAPP
-3.997000e-06
4.020000e-06
-0.995
0.320
-1.190000e-05
3.880000e-06
CAPM
2.573000e-05
2.510000e-06
10.249
0.000***
2.080000e-05
3.060000e-05
DOM
-3.208000e-06
2.370000e-06
-1.354
0.176
-7.850000e-06
1.440000e-06
4 Discussion
The overall takeaway for most aviation stakeholders from the year
2022 is that COVID-19 seems to have become history eventually and that
the industry has returned to normalcy regarding a wide range of
performance indicators. In this study, we have explored the return to
normalcy at the city level, with a focus on analyzing the connectivity
changes across cities and markets. Particularly, using aviation market
data for the years 2019 and 2022, we have compared the number of
departures, the degree (for cities), and the betweenness of entities in
the global aviation system. Our major findings are summarized below.
First, we find that the recovery from COVID-19 preferably took place
across secondary markets. This observation is consistent across all
connectivity indicators and re-appeared through different regression
variables. The observation that domestic markets did start to recover
earlier than international markets has been made in the literature. And
the rationale for such an observation is clear: In most countries,
domestic travel is not susceptible to the uncertainty and impossibility
inherent to travel restrictions. Accordingly, we complement the existing
research by showing that the head start of domestic recovery has turned
into a recovery of secondary markets. Further research is necessary to
better understand the drivers behind this evolution. It could be related
to changes in passenger travel behavior as well as operational /
strategic changes of aviation stakeholders, most notably airlines.
Second, it appears that the connectivity inside Asia has
significantly changed. One major driver for such changes is clearly the
special path China and India took throughout the past three years when
handling the ramifications of the COVID-19 pandemic. Particularly,
Chinese airports were successfully established as aviation hubs for
large parts in South-East Asia. With the disappearance of these hubs, it
is natural that the demand (which did not involve China in the first
place), aims to find different routes through the recovering aviation
system. It will be interesting to see how recent changes in epidemic
regulations of China (including Hong Kong) will lead to a competition
between new routes and hubs, compared with the previous ones.
Third, explaining changes in betweenness seems to be rather
difficult, compared to the indicators based on the number of departures
and the degree centrality. The reasons for this observation are not
entirely clear. It should be noted that - compared to degree centrality
- betweenness centrality is a global network indicator. Accordingly,
changes of one node (or its neighborhood alone) are most certainly not
sufficient for explanation of all changes in the system. In fact, the
loss of betweenness centrality for one set of nodes, e.g., the former
Chinese international aviation hubs, can increase the betweenness
centrality of other cities without actual action taken by the latter.
Such effects need to be considered, when interpreting our results.
Future research could try to include more regression variables and
possibly consider network-aggregated information to better capture
global changes.
This study comes with a set of limitations, addressing these
limitations directly leads to several interesting avenues for future
work. Our analysis did not consider the role of individual airlines and
their strategic behavior (and changes thereof) during the COVID-19
pandemic. Especially in market with airline domination, an analysis at
airline level will presumably lead to a set of additional insights.
Moreover, it is conceivable that additional regression variables can
lead to novel insights. Here, the major problem is to obtain consistent
data for all cities at a global scale. Especially tourism-related data
and information about the extent of travel restrictions and their
duration are promising indicators which could be included in future
studies. Finally, it will be interesting to see how the apparent
recovery continues to develop throughout the next months and whether
there exist other significant long-term changes to the global aviation
system. This question will be particularly relevant in context of newly
emerging contagions and how they interact with global air
transportation.
Acknowledgement
This study is supported by the National Natural Science Foundation of
China (Grant No. U2233214 and Grant No. 62250710166).
References
Abu-Rayash, Azzam, and Ibrahim Dincer. 2020. “Analysis of Mobility
Trends During the COVID-19 Coronavirus Pandemic: Exploring the Impacts
on Global Aviation and Travel in Selected Cities.”Energy
Research & Social Science 68: 101693.
Budd, Lucy, Stephen Ison, and Nena Adrienne. 2020. “European
Airline Response to the COVID-19 Pandemic–Contraction, Consolidation and
Future Considerations for Airline Business and Management.”Research in Transportation Business & Management 37:
100578.
Cheung, Tommy KY, Collin WH Wong, and Anming Zhang. 2020. “The
Evolution of Aviation Network: Global Airport Connectivity Index
2006–2016.”Transportation Research Part E: Logistics and
Transportation Review 133: 101826.
Chu, Amanda MY, Jenny TY Tsang, Jacky NL Chan, Agnes Tiwari, and Mike KP
So. 2020. “Analysis of Travel Restrictions for COVID-19 Control in
Latin America Through Network Connectedness.”Journal of
Travel Medicine 27 (8): taaa176.
Derudder, Ben, and Frank Witlox. 2016. “Global Cities and Air
Transport.” In The Geographies of Air Transport, 119–40.
Routledge.
Dube, Kaitano. 2022. “Emerging from the COVID-19 Pandemic:
Aviation Recovery, Challenges and Opportunities.”Aerospace 10 (1): 19.
Dube, Kaitano, Godwell Nhamo, and David Chikodzi. 2021. “COVID-19
Pandemic and Prospects for Recovery of the Global Aviation
Industry.”Journal of Air Transport Management 92:
102022.
Fan, Terence. 2006. “Improvements in Intra-European Inter-City
Flight Connectivity: 1996–2004.”Journal of Transport
Geography 14 (4): 273–86.
Gudmundsson, Sveinn Vidar, Mattia Cattaneo, and Renato Redondi. 2021.
“Forecasting temporal world recovery in air
transport markets in the presence of large economic shocks: The case of
COVID-19.”Journal of Air Transport Management
91: 102007.
Guimera, Roger, and Luıs A Nunes Amaral. 2004. “Modeling the
World-Wide Airport Network.”The European Physical Journal
B 38: 381–85.
Hanson, Daniel, Tuba Toru Delibasi, Matteo Gatti, and Shamai Cohen.
2022. “How do changes in economic activity
affect air passenger traffic? The use of state-dependent income
elasticities to improve aviation forecasts.”Journal
of Air Transport Management 98: 102147.
Iacus, Stefano Maria, Fabrizio Natale, Carlos Santamaria, Spyridon
Spyratos, and Michele Vespe. 2020. “Estimating and Projecting Air
Passenger Traffic During the COVID-19 Coronavirus Outbreak and Its
Socio-Economic Impact.”Safety Science 129: 104791.
Kaffash, Sepideh, and Dariush Khezrimotlagh. 2022. “US network and low-cost carriers’ performance in response
to COVID-19: Strictness of government policies and passengers’
panic.”Research in Transportation Business &
Management, 100835.
Linden, Erik. 2021. “Pandemics and Environmental Shocks: What
Aviation Managers Should Learn from COVID-19 for Long-Term
Planning.”Journal of Air Transport Management 90:
101944.
Macilree, John, and David Timothy Duval. 2020. “Aeropolitics in a
Post-COVID-19 World.”Journal of Air Transport
Management 88: 101864.
Mhalla, Majdouline. 2020. “The Impact of Novel Coronavirus
(COVID-19) on the Global Oil and Aviation Markets.”Journal
of Asian Scientific Research 10 (2): 96–104.
Michelmann, Johannes, Ulrike Schmalz, Axel Becker, Florian Stroh,
Sebastian Behnke, and Mirko Hornung. 2022. “Influence of COVID-19
on Air Travel - a Scenario Study Toward Future Trusted Aviation.”Journal of Air Transport Management, 102325. https://doi.org/https://doi.org/10.1016/j.jairtraman.2022.102325.
Nhamo, Godwell, Kaitano Dube, David Chikodzi, Godwell Nhamo, Kaitano
Dube, and David Chikodzi. 2020. “Impact of COVID-19 on the Global
Network of Airports.”Counting the Cost of COVID-19 on the
Global Tourism Industry, 109–33.
Nižetić, Sandro. 2020. “Impact of Coronavirus (COVID-19) Pandemic
on Air Transport Mobility, Energy, and Environment: A Case
Study.”International Journal of Energy Research 44
(13): 10953–61.
Rizzi, Cristiano, Mario Tettamanti, and Paolo Rizzi. 2022. “Impact
of Covid-19 on World Aviation Industry, the: Challenges and
Opportunities.”
Serrano, Francisco, and Antonı́n Kazda. 2020. “The Future of
Airports Post COVID-19.”Journal of Air Transport
Management 89: 101900.
Sharma, Jean-Philippe AND Gualdi, Dhruv AND Bouchaud. 2021. “V–,
u–, l– or w–Shaped Economic Recovery After Covid-19: Insights from an
Agent Based Model.”PLOS ONE 16 (3): 1–22. https://doi.org/10.1371/journal.pone.0247823.
Shortall, Ruth, Niek Mouter, and Bert Van Wee. 2022. “COVID-19
Passenger Transport Measures and Their Impacts.”Transport
Reviews 42 (4): 441–66.
Suau-Sanchez, Pere, Augusto Voltes-Dorta, and Natàlia Cugueró-Escofet.
2020. “An Early Assessment of the Impact of COVID-19 on Air
Transport: Just Another Crisis or the End of Aviation as We Know
It?”Journal of Transport Geography 86: 102749.
Suau-Sanchez, Pere, Augusto Voltes-Dorta, and Héctor Rodrı́guez-Déniz.
2016. “The Role of London Airports in Providing Connectivity for
the UK: Regional Dependence on Foreign Hubs.”Journal of
Transport Geography 50: 94–104.
Sun, Xiaoqian, Sebastian Wandelt, Mark Hansen, and Ang Li. 2017.
“Multiple Airport Regions Based on Inter-Airport Temporal
Distances.”Transportation Research Part E: Logistics and
Transportation Review 101: 84–98.
Sun, Xiaoqian, Sebastian Wandelt, and Massimiliano Zanin. 2017.
“Worldwide Air Transportation Networks: A Matter of Scale and
Fractality?”Transportmetrica A: Transport Science 13
(7): 607–30.
Sun, Xiaoqian, Sebastian Wandelt, and Anming Zhang. 2020a. “How
Did COVID-19 Impact Air Transportation? A First Peek Through the Lens of
Complex Networks.”Journal of Air Transport Management
89: 101928.
———. 2020b. “Resilience of Cities Towards Airport Disruptions at
Global Scale.”Research in Transportation Business &
Management 34: 100452.
———. 2021. “Technological and Educational Challenges Towards
Pandemic-Resilient Aviation.”Transport Policy 114:
104–15.
———. 2022. “COVID-19 Pandemic and Air Transportation: Summary of
Recent Research, Policy Consideration and Future Research
Directions.”Transportation Research Interdisciplinary
Perspectives 16: 100718. https://doi.org/https://doi.org/10.1016/j.trip.2022.100718.
Sun, Xiaoqian, Sebastian Wandelt, Changhong Zheng, and Anming Zhang.
2021. “COVID-19 Pandemic and Air Transportation: Successfully
Navigating the Paper Hurricane.”Journal of Air Transport
Management 94: 102062.
Tisdall, Lucas, Yahua Zhang, and Anming Zhang. 2021. “COVID-19
Impacts on General Aviation–Comparative Experiences, Governmental
Responses and Policy Imperatives.”Transport Policy 110:
273–80.
Wandelt, Sebastian, Xiaoqian Sun, and Jun Zhang. 2019. “Evolution
of Domestic Airport Networks: A Review and Comparative Analysis.”Transportmetrica B: Transport Dynamics 7 (1): 1–17.
Wang, Kun, Changmin Jiang, Adolf KY Ng, and Zhenran Zhu. 2020.
“Air and Rail Connectivity Patterns of Major City Clusters in
China.”Transportation Research Part A: Policy and
Practice 139: 35–53.
Appendix
Table 6: Overview on city abbreviations used in this study