Impact of the COVID-19 Pandemic on Multi-airport Systems Worldwide
Xiangru Wu[1], Xiaowen Fu[1], Zheng Lei[2] and Kun Wang[1] [1]Department of Industrial and Systems Engineering, The Hong Kong Polytechnic University, Hong Kong, China [2]Department of Aviation, Swinburne University of Technology, Australia
Abstract: This study examines the impacts of the COVID-19 pandemic on
multi-airport systems (MASs) worldwide. First, the recent literature on
MASs is reviewed to identify emerging research topics and development
patterns. Then, airline schedule data are collected for 53 sample MASs
and used to analyse three dimensions of MAS structures before and during
the late stage of the pandemic: (i) traffic and degree centrality
distribution within MASs, (ii) intra-MAS airport competition; and (iii)
airline competition intensity within MASs. The empirical findings reveal
that MAS structures in Europe and the US have remained relatively stable
despite the recent pandemic, partly because compared with Asia Pacific,
air travel bans in these markets were lifted earlier, and domestic and
international airline markets have largely returned to pre-pandemic
levels. In comparison, significant changes have been observed in
Asia-Pacific MASs due to restrictive bans on international travel and
airline operations. As major airlines shifted capacity to domestic
markets, in Asia Pacific intra-MAS airport traffic distribution became
more balanced, intra-MAS airport competition intensified, smaller
airlines dropped out, and airline concentration levels increased. In
addition, with more under-utilized slots available, Chinese low-cost
carriers increasingly consolidated their operations to selected airports
within MASs which would allow them to achieve economies of scale.
Overall, this study provides insights into the adaptability of MAS
structures in the face of a global crisis.
Keywords:Multi-airport system (MAS);COVID-19 pandemic;Full-service carrier (FSC);Low-cost carrier (LCC) Citation:Wu, X., Fu, X., Lei, Z., and Wang, K. (2023). Impact of the COVID-19 Pandemic on Multi-airport Systems Worldwide. Journal of the Air Transport Research Society 1(1): 117-135 DOI:https://dx.doi.org/10.59521/225FA3D62802E847 Download:PDF
1 Introduction
The air transport industrys rapid growth in recent decades has led to
the fast development of multi-airport systems (MASs) around the world.
In addition to well-known systems in London, New York, Tokyo, and Paris,
emerging countries with booming airline markets, particularly China,
have also developed MASs (Hou et al., 2022). MASs not only alleviate
airport capacity constraints but also optimize airline services and
connectivity for metropolitan areas. Some MASs have airports serving
distinct market positions to diversify the airline services in one
metropolitan area. At the same time, the inter-airport competition
within MASs can reduce airfares and increase flight frequencies,
benefiting passengers and regional economies (Winston and Yan, 2011). A
well-functioning MAS thus stimulates air traffic and coordinates
economic development within and across regions (Brueckner, 2003; Sheard,
2014). The strategic interactions among airports and airlines are more
complex in the presence of MASs, involving decisions about flight
frequency, airfares, airport entries, and network development.
Passengers airport choices depend on factors such as ground access,
flight networks, schedules, and airfares. Previous studies have
documented these issues through theoretical and empirical approaches, as
summarized and discussed in Section 2 of
this paper.
The COVID-19 pandemic (hereafter referred to as “the pandemic”) has
had unprecedented impacts on the entire airline industry, and extensive
research has been conducted to understand its effects from different
perspectives (Sun et al., 2020; Nižetić, 2020; Suzumura et al., 2020;
Zhang et al.,2021; Czerny et al. 2021). Existing studies of the
pandemic’s impact on airport operations have mainly focused on
individual airports of different sizes and regions. Travel restrictions
have severely damaged international connectivity for major regional
gateway airports worldwide, while domestic aviation markets have
generally recovered as outbreaks have been contained domestically,
despite several waves of local outbreaks. The pandemics impact on
airports may also depend on their network structure, such as
hub-and-spoke vs. point-to-point, as well as the type of airlines
(full-service carriers (FSCs) vs. low-cost carriers (LCCs)) and airline
dominance at a particular airport, because such factors are likely to
moderate the pandemics effect on airport operations, airline competition
and dominance, and network configuration (Fu et al. 2015a, 2019).
Despite extensive research on the impacts of the pandemic on the air
transport industry, there has been relatively little investigation into
how MASs have been affected. Many questions remain unanswered in this
area. First, the pandemic could have affected different airports in the
same MAS differently, causing changes in traffic and connectivity
distributions among individual airports. Second, inter-airport
competition within MASs might have been affected, with market coverage
converging (serving more common destinations) or diverging (serving
fewer common destinations) during the pandemic. Last, the pandemic could
have caused variations in airline competition (including that among
airlines providing differentiated services, such as FSCs vs. LCCs (Fu et
al. 2011)) and their dominance among different airports (such as an
airports hub status). For example, Londons metropolitan area is served
by six international airports, with Heathrow (LHR) dominated by British
Airways and Gatwick (LGW) as a main base for Easyjet, a low-cost
carrier. The pandemic is likely to have imposed heterogeneous impacts on
these airports within the London MAS, which could have significant
implications on airline competition, airport capacity/slot use, and
airport connectivity. The pattern and magnitudes of such impacts
nevertheless remain unclear to industry and policy makers. This study
aims to address these gaps in the literature by examining the impacts of
the pandemic on MASs worldwide, shedding light on the changes and
development patterns of these systems.
To address the research questions outlined above, we collected
airline scheduled seat data for 53 MASs worldwide over the 2018-2022
period. Several statistics and indices were calculated and benchmarked
before and during the late stage of the pandemic, with a focus on the
relatively long-term impact of the pandemic. We conducted an intra-MAS
analysis to examine the heterogeneous impacts of the pandemic on the
traffic and network size of airports within the same MAS, calculating
the Gini index of scheduled capacity and the degree of centrality for
each MAS. Additionally, we constructed a Herfindahl-Hirschman Index
(HHI) using the capacity share of flights with the same destination but
originating from different airports within an MAS, to measure the level
of intra-MAS airport competition. We were also interested in checking
the change in this index during the pandemic. To examine inter-airline
competition, particularly between FSCs and LCCs within an MAS, we
calculated and compared the Gini index of the airlines market shares in
each MAS before and during the late stage of the pandemic. We conducted
these analyses for each sample MAS and conducted cross-regional
comparisons to shed light on heterogeneous patterns among different
regions worldwide, including the US, Europe, and the Asia-Pacific.
The remainder of this paper is structured as follows. Section 2 provides a review of the
relevant literature on MAS published in recent years, revealing recent
MAS developments and relevant research hotspots worldwide. Section 3 describes the data used in this
research, including the definition and selection of sample MASs for this
study. In Section 4, we conduct a series of
calculations based on the statistics and indices described in the
previous paragraph and provide a discussion and interpretation of the
results. Finally, Section 5
provides concluding remarks for this study.
2 Literature Review
This section presents a review and summary of the recent literature
on MAS development, with a focus on academic publications in the past
decade (since 2013) related to MAS management and economic issues.
Relevant studies can be broadly categorized into two categories: those
investigating passengers airport choices within an MAS and those
examining airline/airport competition within an MAS. Additionally, we
review recent studies of the impacts of the pandemic on airport
operations, which should provide useful insights into the impacts on
MASs.
2.1 Passengers’ airport choices in
MASs
Since the 1980s, it has been a common research strategy to examine
passengers airport choices within an MAS. Analytical and empirical
research has explored the factors influencing passengers airport
choices, with a focus on some major MASs in the US and Europe,
particularly San Francisco, New York, and London (Harvey, 1987; Pels et
al., 2000, 2001, 2003; Hess et al., 2006; Marcucci and Gatta, 2011,
2012; Murça et al., 2013). These studies suggest that the ground access
time and cost, flight frequency, and flight time play important roles in
determining passengers airport choices, with passengers
exhibiting heterogeneous preferences for different factors.
In recent years, an increasing number of researchers have paid
attention to MASs in developing countries, such as China, Iran,
Slovenia, and Brazil. Table 1 summarizes papers on this topic published
in the last decade, which focused on different factors that shape
passengers airport choices. In addition to the
aforementioned influencing factors, recent studies have also considered
new factors related to passengers perceptions of service quality, such
as safety and punctuality, which also contribute significantly to
passengers choice decisions. Some studies investigate air-rail
intermodal transport for MAS connectivity and its influence on
passengers airport choices. Both theoretical and empirical studies have
suggested that passengers choose air-rail intermodal transport if one
airport has better integration with high-speed rail (HSR) service, such
as Hongqiao Airport in Shanghai MAS and Daxing Airport in Beijing MAS,
due to considerations related to the contingency arrangement in case of
delays and regarding checking-in, comfort, and luggage
deposits (Chiambaretto et al., 2013; Li et al., 2020; Wang et al., 2020a;
Babić et al., 2022).
Table 1: Recent literature on passenger airport choice in MAS
Author/Year
Studied MAS
Model
Specifications/Findings
Fuellhart et al. (2013)
Boston, Washington, and San Francisco, the
US
Higher route-level airfares and longer
route distance lead to an apparent switching of passengers’ airport
choices. This means passengers may be willing to make changes to a
preferred airport for longer distance trips.
Mamdoohi et al. (2014)
Tehran MAS, Iran
Binary Logit model; Focus on the
difference of airport choice between resident and non-resident and find
that public access, flight frequency, and airport tax are more important
for non-resident air travelers when choose their origin airport.
Paliska et al. (2016)
Upper Adriatic region, Slovenia
Mixed logit model; Access time to airport
is the most important determinant in airport choice for all kinds
travelers (business/leisure and cross-border/domestic) and borders have
an influence on airport choice.
Jung and Yoo (2016)
Seoul MAS, South Korea
Two-level Nested Logit model; The results
show that fare, flight time, frequency, access time, access cost and
airport access convenience latent variables are significantly affecting
passengers airport choice behavior.
Bezerra and Gomes, (2019)
São Paulo MAS, Brazil
Partial least squares–structural equation
model; Support airport service quality as a determinant of passenger
loyalty. Marketing and operational strategies based on customer
segmentation help to strengthen the passenger loyalty to the
airport.
Tiglao (2020)
Aklan MAS, Philippines
Discrete choice model; Tourist passenger
do put high premium in air safety.
Teixeira and Derudder (2021)
New York MAS, the US
Huff models; Consider the spatio-temporal
dynamics in airport catchment areas and calculate airport attractiveness
to passengers in different census block groups.
Liao et al. (2022)
Guangdong-Hong Kong-Macao Greater Bay Area
(GBA), China
Partial least squares structural equation
model; Confirm positive relationships between airport service quality
and passengers’ intention to reuse an airport.
2.2 Airline or airport competition
in MASs
As mentioned in the introduction, the presence of an MAS enhances
strategic interactions among airports in a region and intensifies both
inter- and intra-airport airline competition. In recent years,
researchers have paid increasing attention to the privatization of one
or more airports within an MAS, following the global trend towards
airport corporatization. This trend has been particularly notable in
China, where several airports have consolidated to form airport group
companies to improve profitability and achieve better coordination.
Furthermore, the prevalence of HSR has significantly reshaped the
intercity transport market, particularly in China. The integration of
air and HSR transport with some airports within an MAS can significantly
affect airport and airline competition and coordination behaviour.
Recent studies have investigated the impacts of these developments on
MASs and their implications for airport and airline operations and
competition. Table 2 provides a summary of these studies published over
the past decade.
Table 2: Recent literature on inter-airport and airline competition in
MAS
Author/Year
Studied MAS
Model
Specifications/Findings
Yan and Winston (2014)
San Francisco Bay area, the US
Focus on the private airport competition
and find that private airport competition could increase commercial
travelers welfare and airlines profits and enable the airports to be
profitable.
Liao et al. (2019)
Guangdong-Hong Kong-Macao Greater Bay Area
(GBA), China
Three liner models; Focus on the route
level competition between airports in GBA-MAS and its impact on
passenger airport choice.
Wong et al. (2019a)
MAC around world
With the competition of FSCs, LCC shift
focus from smaller airports in MAR to non-MAR airports.
Wong et al. (2019b)
MAC around world
Discuss the competition for passengers
among hubs and secondary airports in multi-airport cities.
Cheung et al. (2020)
Guangdong-Hong Kong-Macao Great Bay Area
MAS, China
Dynamic spatial panel regression model,
the model provides a new tool in airport competition study. This paper
focus on the spatial interactions and spillover effects in the presence
of airport competition.
Hou et al. (2022)
Beijing MAS, China
Multi-stage game-theoretical model; Focus
on the impact of government intervention on airport competition. Find
that without government intervention in airline allocation between the
two airports, airlines would always prefer to enter both airports in the
MAS, leading to both an inter-airport and an intra-airport competition
structure.
de Paula Balan et al. (2022)
São Paulo and Rio de Janeiro MAS,
Brazil
Increased overlap routes in MASs were
healthy for competition between airports and airlines over the
years.
Li et al. (2022)
Theoretical analysis
Investigates the effects of air and
high-speed rail (HSR) cooperation on airport competition in MAS and
social welfare.
2.3 The impact of the pandemic on
the airport
The pandemic has had an unprecedented impact on the aviation
industry, as evidenced by recent studies (Zhang et al., 2020; Sun et
al., 2020; Czerny et al., 2021; Sun et al., 2021a; Salesi et al., 2022).
Researchers have conducted numerous investigations into the pandemics
effects on airport connectivity and operations and its heterogeneous
impacts across different airports and regions. Sun et al. (2022)
provided a comprehensive review of the research on the pandemic and air
transport. Specifically, regarding the impact on airport operations,
many studies have focused on the passenger travel experience during the
pandemic. For example, Li et al. (2022) used a data-driven
crowd-sourcing approach to study airport service quality during the
pandemic. Ma et al. (2022) built a structural equation model to
investigate the influences of four attributes of the airport physical
environment on passengers perceived safety, satisfaction, and travel
intentions during the pandemic. Zhang et al. (2021) used passengers air
ticket booking transaction data and airport arrival data to empirically
examine passengers travel behaviours during the pandemic and found that
passengers arrived at the airport earlier to undergo health check
procedures, despite having fewer opportunities to shop and dine at
airports. Chen (2022a, b) also found very obvious empirical evidence for
the substitutability of online meetings for air travel among
heterogeneous traveller, which could also cause changes in passenger
composition and air travel behaviour during and after the pandemic.
Many researchers have focused on the impact of the pandemic on
airport connectivity and have found that airport networks changed
significantly during the pandemic. These changes include shifts in
airport degree centrality, international connections, and network
connectivity (Sun et al., 2020, 2021b; Li et al., 2021; Kuo et al.,
2022). Several studies have concluded that the pandemic has had a
greater impact on international flights than on domestic flights, and
that the recovery speed of local connectivity has been faster than that
of global connectivity (Sun et al., 2020, 2021b; Li et al., 2021; Zhang
et al., 2022). For example, researchers studying Incheon International
Airport discovered that although the airports efficiency decreased
during the pandemic, the increase in connectivity between Incheon and
other airports could improve the airports efficiency (Shamohammadi et
al., 2022).
Some studies have shed light on the heterogeneous impact of the
pandemic on different types of airports, including hub and nonhub
airports. For example, Mueller (2022) found that non-hub airports in
Europe experienced more negative impacts than hub airports. Airports
primarily served by LCCs were more likely to be cut off from the network
during extensive network shrinkage than those served by FSCs. Other
studies have examined the heterogeneous impacts of the pandemic across
different regions and countries. Sun et al. (2020) reported that Europe
has undergone more significant changes in network connectivity than
North America. Many countries in North America, such as the United
States, Canada, and Mexico, remained highly connected with other
countries during the pandemic. Sun et al. (2021b) also found that,
compared to other countries, the impact of the pandemic on airports in
the United States was relatively homogeneous, with most airports only
partially affected. Although there have been many studies that have
explored the impacts of the pandemic on airports from different aspects,
there are still no papers dedicated to examining the impact on MASs. For
the characteristics of MASs, this study aims to investigate this topic
to fill this research gap.
3 Data and MAS Samples
An MAS is defined as a set of two or more commercial airports that
serve air traffic within a metropolitan region (Bonnefoy et al., 2010),
regardless of the ownership or political control of individual airports
(de Neufville, 2004). In this paper, we adopt the
definition of Bonnefoy et al. (2010) to select sample MASs. Bonnefoy et
al. (2010) used worldwide airport passenger traffic data from the
International Civil Aviation Organization (ICAO) (2008) and the Federal
Aviation Administration (2007), including all airports with more than
500,000 passengers in 2005. A geographical cluster analysis was
conducted to identify MASs. To identify all airports located within a
60-mile radius of the city centre, clusters of two or more significant
airports within 120 miles of each other were first identified. Then,
certain MASs were excluded based on geographical characteristics, such
as the presence of islands and the criterion that the largest airport
served fewer than two million passengers per year. Based on this
analysis, they identified 59 MASs, which was updated to 60 in 2011 (de
Neufville, 2016). Sun et al. (2017) also defined major commercial
airports as those with at least two million passengers per year.
We retrieved our airline scheduled seat data from the Official
Airline Guide (OAG) for the sampled MASs as identified in Bonnefoy et
al. (2010). These data include departure and arrival airports and
airline-specific scheduled seats on a quarterly basis for the 149
airports in the 60 sample MASs from Q1 2018 to Q4 2022, covering both
the pre-pandemic and the pandemic periods. The OAG database also
includes variables indicating whether a route is domestic or
international, and whether an operating airline is an FSC or an LCC.
However, during our study period, one airport in each of the Belo
Horizonte, Gothenburg, Tel Aviv, and Berlin MASs closed, leading us to
exclude these four systems. Additionally, Beijing was included in the
MAS list by Bonnefoy (2010), since the city is served by two airports.
However, Nanyuan Airport serves only regional routes out of Beijing
under special approval granted to selected airlines only and is much
smaller than Beijing Capital Airport. Therefore, we also excluded
Beijing from our sample.1 Similarly, Lübeck Airport in the
Hamburg MAS only serves a limited number of regional routes, leading us
to exclude Hamburg as well. In the end, we identified a total of 53 MAS
in 24 countries for study, as shown in Table 3.
Table 3: Sample MASs in this study
Region
MAS Country
Airports
MAS Country
Airports
Asia-Pacific
Melbourne AU
Melbourne, Avalon
Hong Kong CN
Hong Kong, Shenzhen
Shanghai CN
Pudong, Hongqiao
Taipei CN
Taoyuan, Songshan
Osaka JP
Kansai, Itami, Kobe
Tokyo JP
Haneda, Narita
Seoul KR
Incheon, Gimpo
Bangkok TH
Suvarnabhumi, Don Mueang
Europe
Brussels BE
Brussels, S. Charleroi, Liege
Paris FR
de Gaulle, Orly, Beauvais-Tille,
Chalons-Vatry,
Dusseldorf DE
Duesseldorf, Cologne-Bonn, Dortmund,
Weeze
Frankfurt DE
Frankfurt, Hahn
Stuttgart DE
Stuttgart, Baden
Milan IT
Malpensa, Bergamo, Linate
Pisa IT
Pisa, Florence
Rome IT
Fiumicino, Ciampino
Venice IT
Marco Polo, Treviso
Amsterdam NL
Amsterdam, Eindhoven, Rotterdam
Oslo NO
Gardermoen, Sandefjord-Torp
Moscow RU
Sheremetyevo, Domodedovo, Vnukovo
Vienna SK
Vienna, Bratislava
Barcelona ES
Barcelona, Girona, Reus
Copenhagen SE
Copenhagen, Malmo
Stockholm SE
Arlanda, Bromma, Skavsta
Istanbul TR
Istanbul, Sabiha Gokcen
Belfast UK
Belfast, George Best
Glasgow UK
Edinburgh, Glasgow, Prestwick
London UK
Heathrow, Gatwick, Stansted, Luton, London
City
Manchester UK
Manchester, Liverpool, Leeds Bradford
Latin America & Middle East
Buenos AR
Newbery, Ministro Pistarini
Rio de Janeiro BR
Rio de Janeiro, Santos Dumont
Sao Paulo BR
Guarulhos, Congonhas, Campinas
Tehran IR
Mehrabad, Khomeini
Mexico City MX
Mexico City, Toluca
Dubai AE
Dubai, Sharjah
North America
Toronto CA
Pearson, Billy Bishop, Hamilton
Vancouver CA
Vancouver, Abbotsford
San Diego US
San Diego, Tijuana
Boston US
Logan, Providence, Manchester-Boston
Chicago US
OHare, Midway, Rockford
Cleveland US
Hopkins, Akron
Dallas US
Dallas, Love Field
Detroit US
Metropolitan Wayne, Flint
Houston US
George Bush, Hobby
Los Angeles US
Los Angeles, Santa Ana, Burbank, Ontario,
Long Beach
Miami US
Miami, Lauderdale
New York US
Kennedy, Liberty, LaGuardia, Islip
Norfolk US
Norfolk, Williamsburg
Orlando US
Orlando, Sanford
Philadelphia US
Philadelphia, Atlantic City
San Francisco US
San Francisco, San Jose, Oakland
Tampa US
Tampa, St Pete-Clearwater, Sarasota
Washington US
Baltimore, Dulles, Reagan
4 Statistics and Discussions
In this section, we calculate and discuss some statistics and indices
to shed light on the impact of the pandemic on MASs worldwide. For
concise discussions and clear insights, we concentrate on the major MASs
in each region (i.e., North America, Europe and Asia Pacific) while
reporting the statistics of all sample MASs in the appendix.
4.1 Traffic and network size
distribution within MAS
Individual airports within an MAS may focus on different markets or
be served by different types of airlines. For example, FSCs may utilize
hub airports to develop extensive regional and inter-continental
networks that enable them to leverage various cost and competitive
advantages (Zhang 1996; Tu et al, 2020), whereas secondary airports may
focus on regional destinations and serve many LCC flights (Wang et al.
2020b). Airlines’ frequency choices depend significantly on traffic
volume and slot availability, which in term further affect service
equality and passenger demand (Wang et al. 2014). The pandemic cause
significant yet non-uniform demand reduction, which are likely to have
imposed heterogeneous impacts on different airports. To capture the
degree of possible uneven or unequal distributions among various
entities, we adopt the Gini index as a commonly used measure. We
calculate the Gini index of traffic and degree centrality for the
sampled MASs before and during the late stage of the pandemic, based on
data from Q3 2019 and 2022. The degree centrality is defined as the
total number of destinations linked with each airport via direct
flights, and it helps to measure the network scope of a particular
airport. The Gini index is calculated using the following equation,
which measures the degree of inequality in the distribution of airport
traffic within the same MAS: GM=( \textstyle åi=1m
\textstyle åj=1m
| Yit-Yjt
| )/(2m2Ym ), where Yi is the degree
centrality or scheduled seats of airport i, and m is the number of airports in one
MAS. The Gini coefficient is GM and it can
theoretically range from 0 (complete equality) to 1 (complete
inequality). The larger that the coefficient is, the more unequal that
the distribution of airport seats is within the MAS.
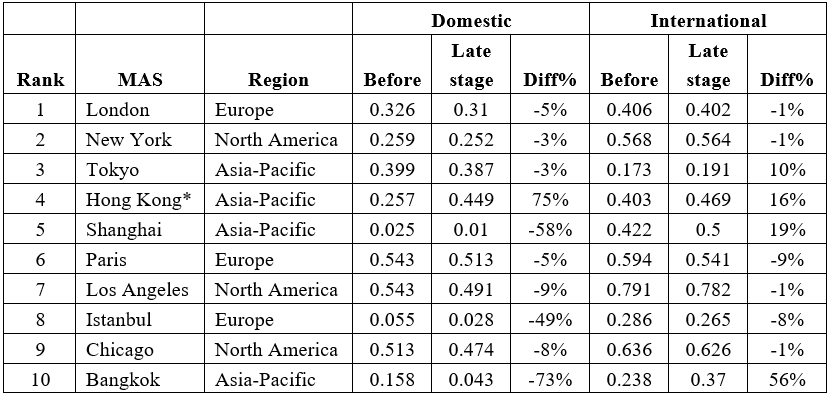
Tables 4 and 5 present the Gini indices of the degree centrality and
traffic volume (measured by scheduled seats) for the top 10 MASs in the
world, respectively. In the case of London, where international services
control a lion’s share of the market, our analysis primarily reflect the
dynamics of its international market. The Gini indices of both degree
centrality and traffic remained relatively stable before (Q3 2019) and
during the pandemic (Q3 2022), mainly due to the lifting of travel bans
across European countries (and North America) during 2022, which led to
a recovery in the intra-European and cross-Atlantic markets. The Gini
indices of the degree of centrality and traffic in major US MASs,
including New York, Los Angeles, and Chicago, as of Q3 2022, did not
change significantly compared with those in Q3 2019. This finding
demonstrates that the network and traffic distributions of US MASs were
relatively stable once the pandemic was contained and travel
restrictions were lifted. This pattern also applies to MASs in Paris.
However, for Istanbul, we observe a more unevenly distributed degree of
centrality in the domestic market during the pandemic. Istanbul Ataturk
Airport is the primary airport in this MAS, focusing on both
international and domestic markets, while Sabiha Gokcen Airport mainly
serves the domestic market through LCC services. Prior to the pandemic,
55% of domestic traffic was served by Sabiha Airport. However, with the
pandemics impact, Sabiha Gokcen Airport withdrew some domestic routes,
resulting in a decrease in domestic traffic to a level close to that of
Ataturk Airport.
Table 4: Gini index of the degree centrality before (Q3 2019) and during late stage of pandemic (Q3 2022) for top 10 MASs
Notes:
l. The “before" represents the Q3 of 2019, and "late stage" represents
Q3 of 2022. For Hong Kong
MAS, it only constitutes Hong Kong and Shenzhen airports.
2.The rank of the airports are defined by the total scheduled seats of
the MAS at Q3, 2019.
Conversely, the MASs in Asia have experienced significant changes in
the Gini indices of degree centrality and traffic before and during the
late stage of the pandemic. In the case of the Tokyo MAS, Tokyo Narita
Airport primarily serves the international market, accounting for 67% of
international traffic as of Q3 2019. Haneda Airport, in contrast,
focuses mainly on the domestic market, serving 90% of domestic traffic
in the same period. Japan adopted stricter travel bans than European and
North American countries, with Narita Airport being affected
particularly strongly, resulting in a significant decrease in its
international degree centrality, from 120 in 2019 to 71 in 2022.
Consequently, the difference in international degree centrality between
Narita and Haneda decreased during the pandemic, leading to a 25%
decrease in the Gini index of degree centrality in the international
market. Although the number of international routes from Narita
decreased significantly, the airport’s dominance in the international
market led to an increase in the proportion of international traffic
served, resulting in a 10% increase in the Gini index of traffic. Such
findings are consistent with the empirical evidence of Ng et al. (2022),
who indicated that the Japanese airline market was heavily affected by
the pandemic, with the two dominant airlines (All Nippon Airways and
Japanese Airlines) strengthening their competition in the major domestic
routes linking to Haneda and Narita airports.
In the case of Shanghai, both Pudong and Hongqiao airports serve a
considerable number of domestic destinations. However, Hongqiao Airport
serves only a small number of international destinations, mainly
short-haul flights to Japan and Southeast Asia, while almost all
international flights are served by Pudong Airport. During the pandemic,
Pudong Airport had more under-utilized slots due to Chinas
implementation of strict bans on international airline services. As a
result, Pudong added flights to more domestic destinations, further
exceeding Hongqiao in degree centrality in the domestic market. Since
Hongqiao previously dominated the domestic traffic volume, the rise of
Pudong Airport in domestic services narrowed the domestic traffic
imbalance during the pandemic, leading to a 58% reduction in the Gini
index of domestic traffic. For Hong Kong, the Chinese government banned
flights between Hong Kong and mainland China, resulting in a significant
drop in the number of domestic routes and traffic at Hong Kong Airport,
increasing the Gini indices of domestic degree centrality and traffic of
the MAS by 63% and 75%, respectively. Shenzhen cut almost all
international flights during the pandemic, while Hong Kong maintained
more international flight services, further exacerbating the uneven
distribution of international air services in this MAS.
The Gini indices of degree centrality and traffic for the other
sampled MASs are compiled in Appendix Tables 8 and 9, respectively.
Overall, the observations indicate that, for European and US airports,
the overall inequality of traffic and degree centrality did not change
significantly by the end of 2022 compared to pre-pandemic conditions,
because domestic traffic and international traffic volumes recovered in
a similar pattern. In contrast, for the Asian Pacific MASs, the stricter
international air travel bans adopted by these countries were more
strict and lasted for much longer periods, which led to a significant
redistribution of traffic and networks in the international markets. As
airports with more idle slots from international operations switched to
domestic flight services, the intra-MAS distribution of domestic
operations also underwent significant changes.
Table 4: Gini index of the traffic (scheduled seats) before (Q3 2019) and during late stage of the pandemic (Q3 2022) for
top 10 MASs
Notes:
l. The “before" represents the Q3 of 2019, and "late stage" represents
Q3 of 2022. For Hong Kong
MAS, it only constitutes Hong Kong and Shenzhen airports.
2.The rank of the airports are defined by the total scheduled seats of
the MAS at Q3, 2019.
3.*The Hong Kong MAS includes the airports in the two nearby cities of
Hong Kong and Shenzhen.
4.2 Intra-MAS airport competition
and market overlap
In this subsection, we focus on the origin-destination (OD) level
competition among different airports within one MAS. That is, the
different airports in one MAS might offer direct flights to the same
destination. The intra-MAS airport competition is fiercer when airports
serve more overlapping destination markets. To more accurately capture
such intra-MAS competition (degree of market overlap), we devise with
the following Herfindahl-Hirschman (HHI) index on each route originating
from one MAS: OD\_HHI_Mj = ålimits_i=1m
((q_ij Q_Mj )2 where QMj is
the total scheduled seats from MASM to destination airport j; qij is
the scheduled seats from airport i in the MAS to destination airport
j; and m is the number of airports in MAS
M. Then, for each sample MAS,
we are able to calculate this HHI index for each OD market. A larger
value of HHI suggests higher market concentration, or more dominance of
the leading airport(s) within the MAS serving this OD market.
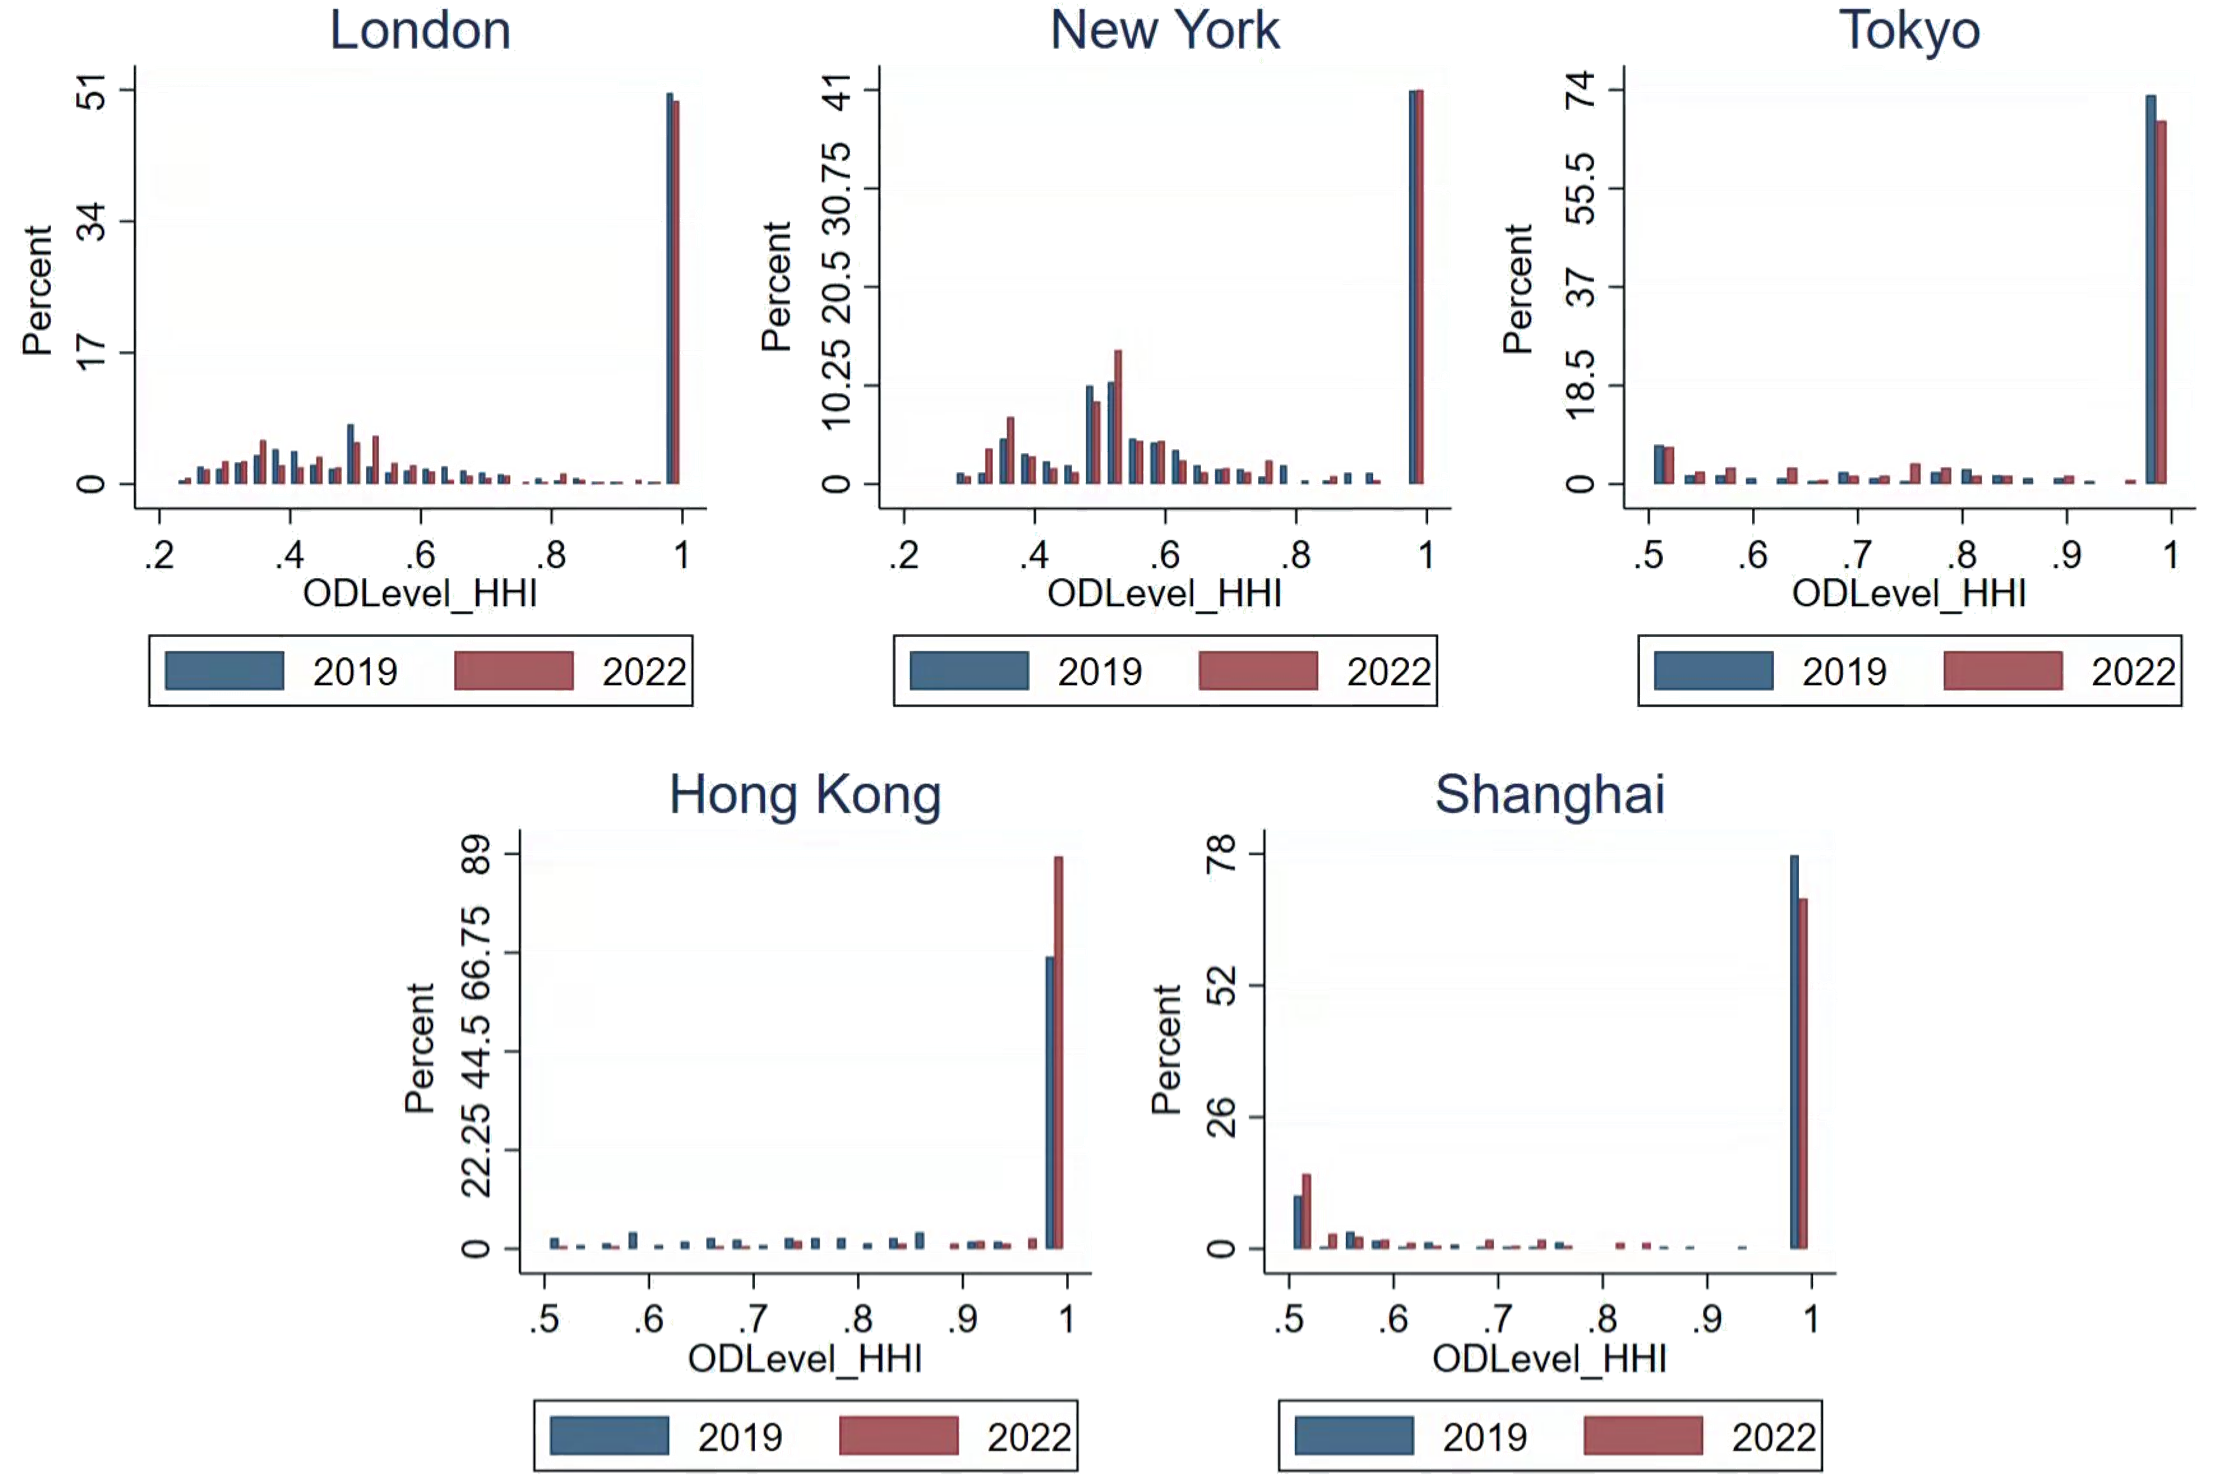
For our empirical investigation, we focus on the top 5 MASs
worldwide, namely London, New York, Tokyo, Hong Kong, and Shanghai.
These MASs are distributed in major regions around the world. In
Figure 1 and Figure 2, we present
the percentage distributions of the OD level HHIs, as calculated in Eq.
(2). For the London MAS, the HHI index became more concentrated towards
lower values, indicating more intense competition among different
airports in the London MAS. As we discuss in more detail in the next
subsection, British Airways dominated at London Heathrow Airport, while
LCC Easyjet operated its base airport at London Gatwick Airport. During
the pandemic, British Airways relocated its capacity from
intercontinental routes to more intra-European routes at its Heathrow
hub, leading to more head-to-head competition with Easyjet at London
Gatwick. For the New York MAS, there was no significant change in the OD
level HHI during the pandemic. This outcome can be attributed to the
almost full recovery of the US aviation market in Q3 2022 compared with
Q3 2019, with airlines returning service levels and network
configurations to pre-pandemic levels. In other words, we did not
observe any clear or long-term changes in the MAS structure caused by
the pandemic in the US.
In the case of the Tokyo MAS, the intra-MAS competition between
Narita and Haneda airports appeared to intensify, with an overall
decrease in the OD level HHI. This result occurred primarily because,
during the pandemic, both airports cut services in thin markets and
focused on denser and more lucrative routes, enhancing their market
overlap and head-to-head competition. For the Hong Kong MAS, both the
Hong Kong and Shenzhen airports were heavily impacted during the
pandemic. Before the pandemic, they served many common destinations in
mainland China, as well as short- to medium-haul international routes.
However, most of the flights from Hong Kong to mainland Chinese cities
were suspended during the pandemic, and international flights from
Shenzhen were also dramatically reduced. Consequently, the two airports
networks became very distinct during the pandemic. Last, in the case of
the Shanghai MAS, the competition between the Hongqiao and Pudong
airports became much more intense. As discussed in the previous
subsection (4.1), to alleviate the adverse impact of the pandemic,
Pudong Airport expanded its domestic market services, resulting in
increased head-to-head competition with Hongqiao Airport in many
domestic OD markets.
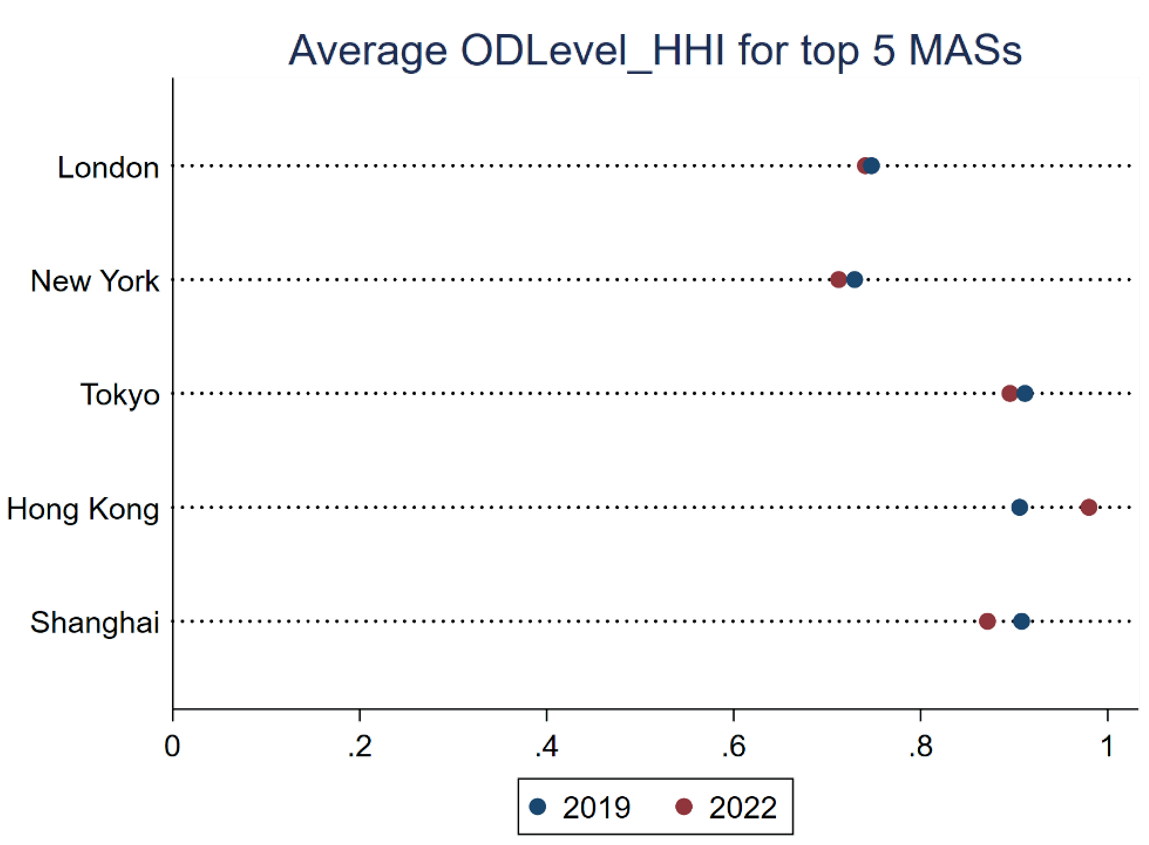
We also calculated the average OD level HHI for each MAS to provide
an overall measure of changes in airport competition within the MAS (as
illustrated in Figure 2). Except for the Hong Kong MAS, all four of the
other systems experienced increased intra-MAS airport competition during
the later stage of the pandemic, consistent with our earlier
analysis.
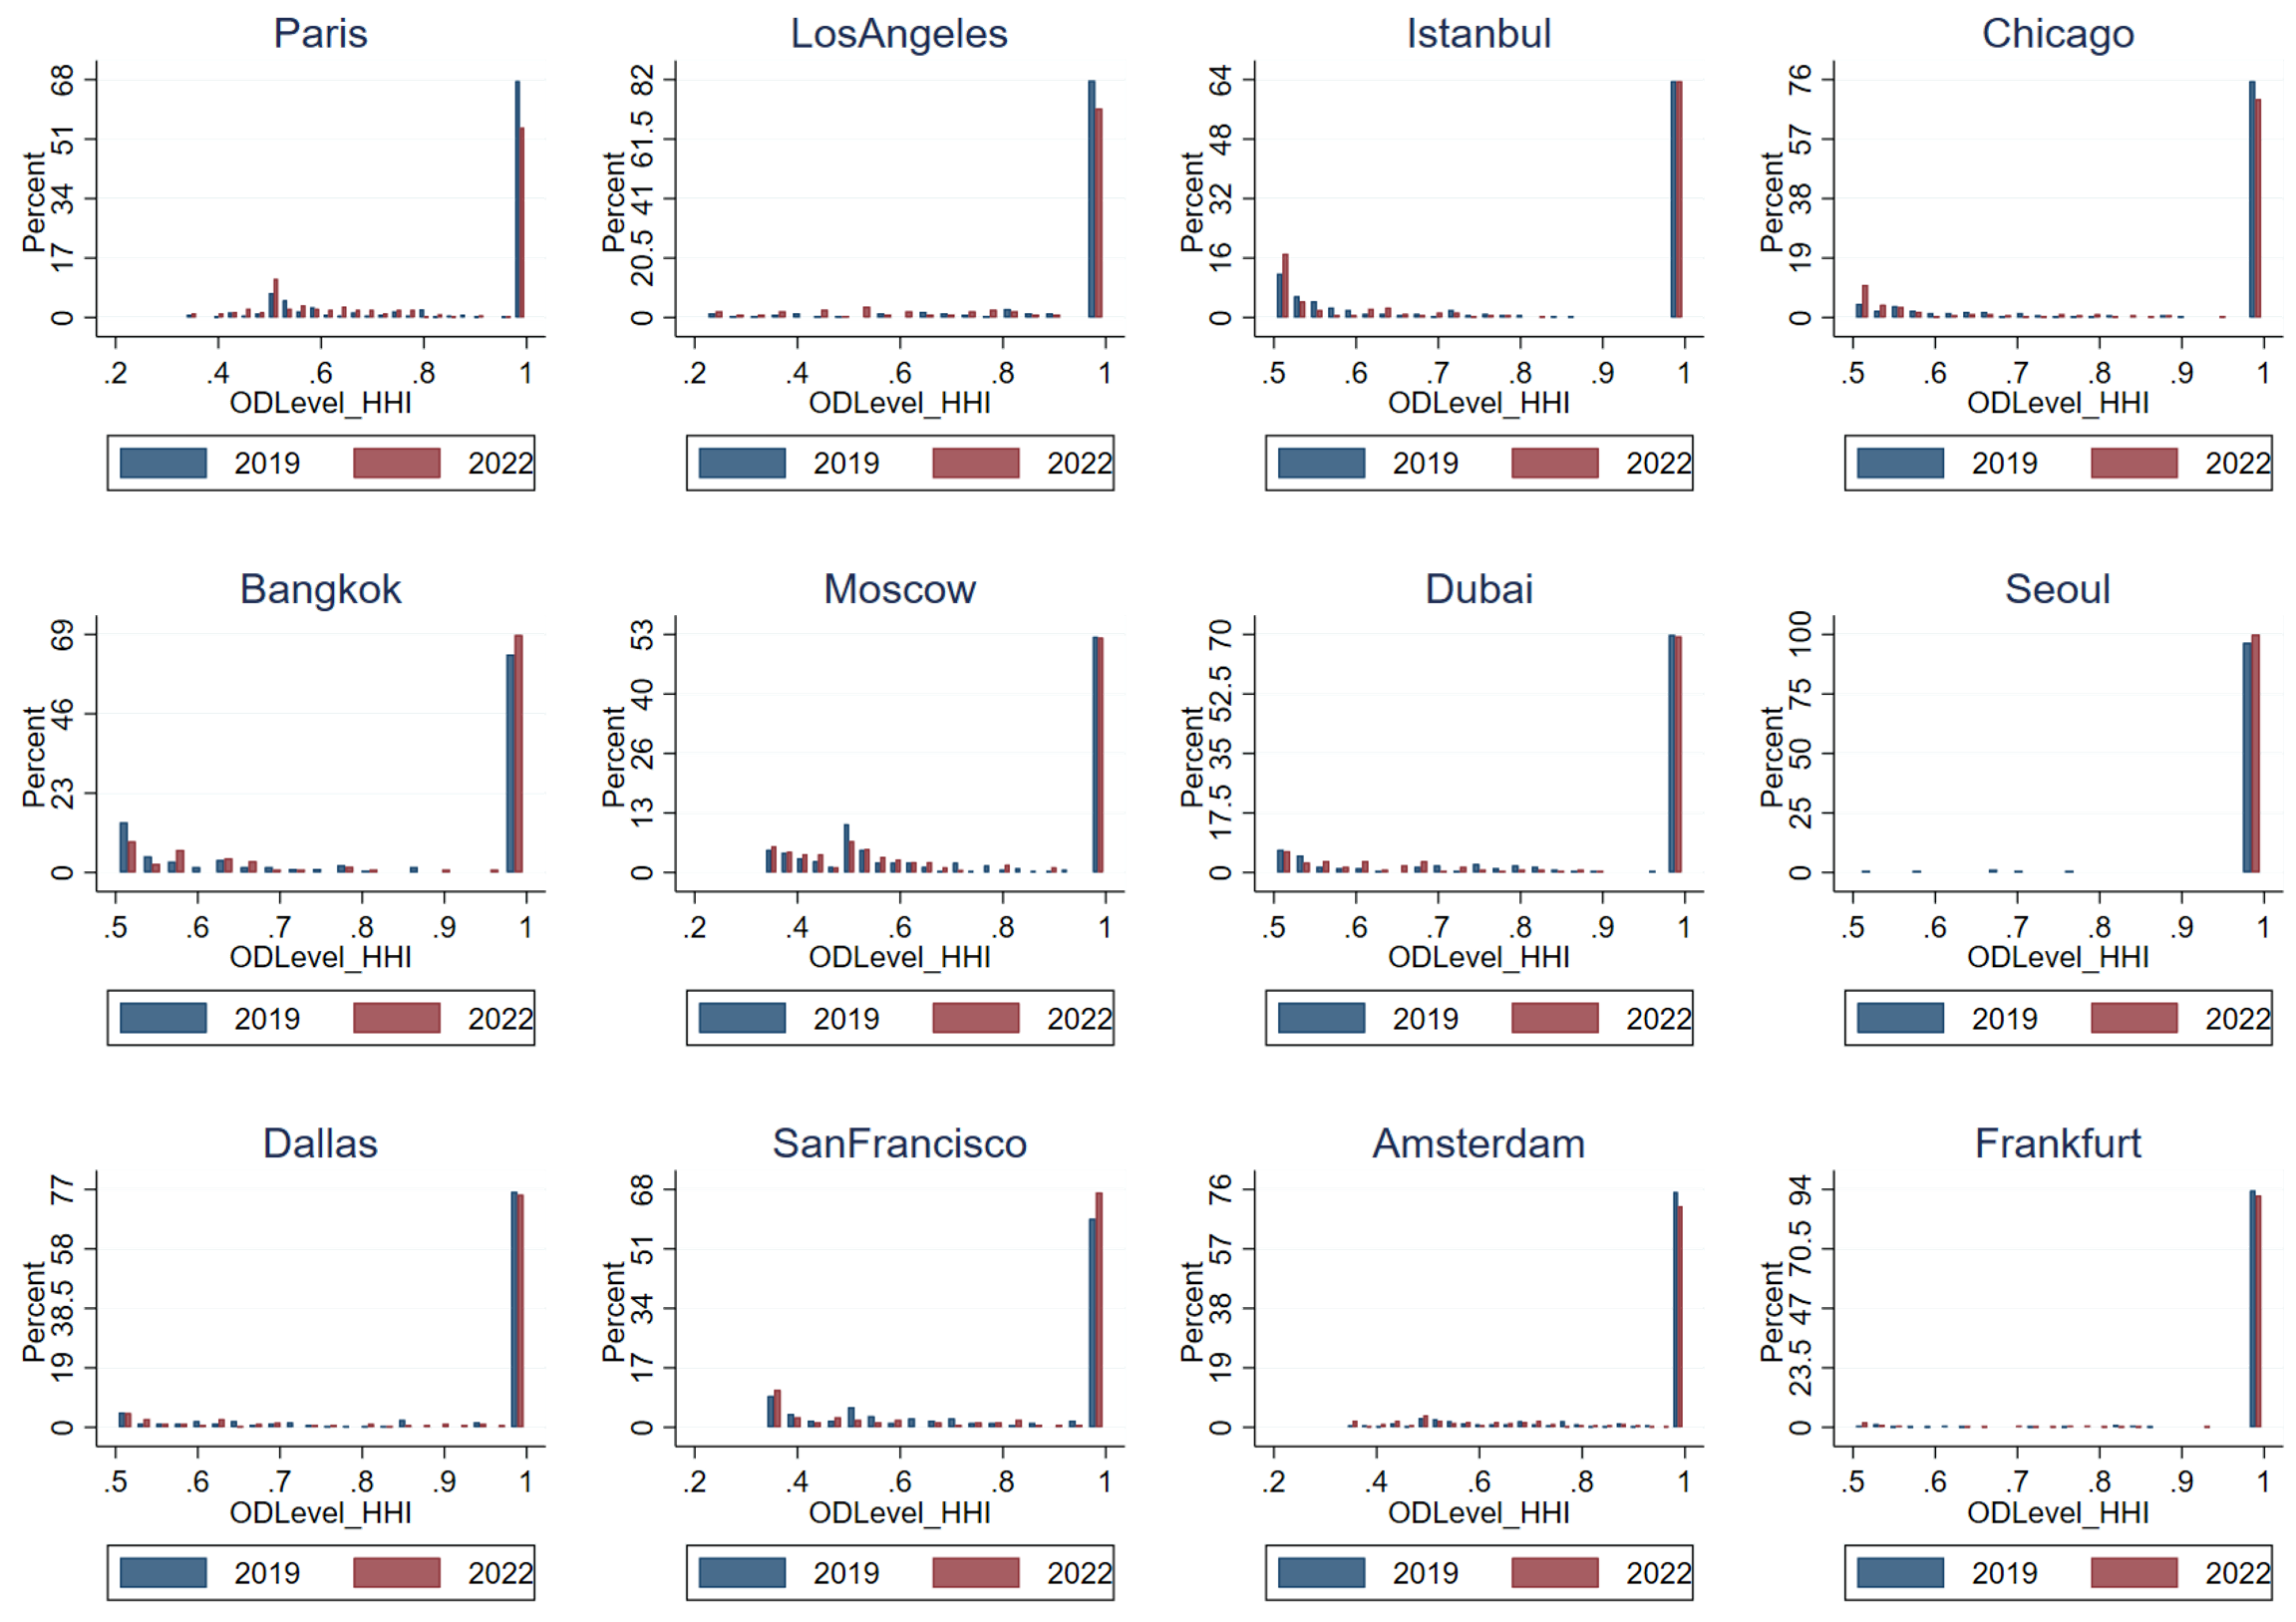
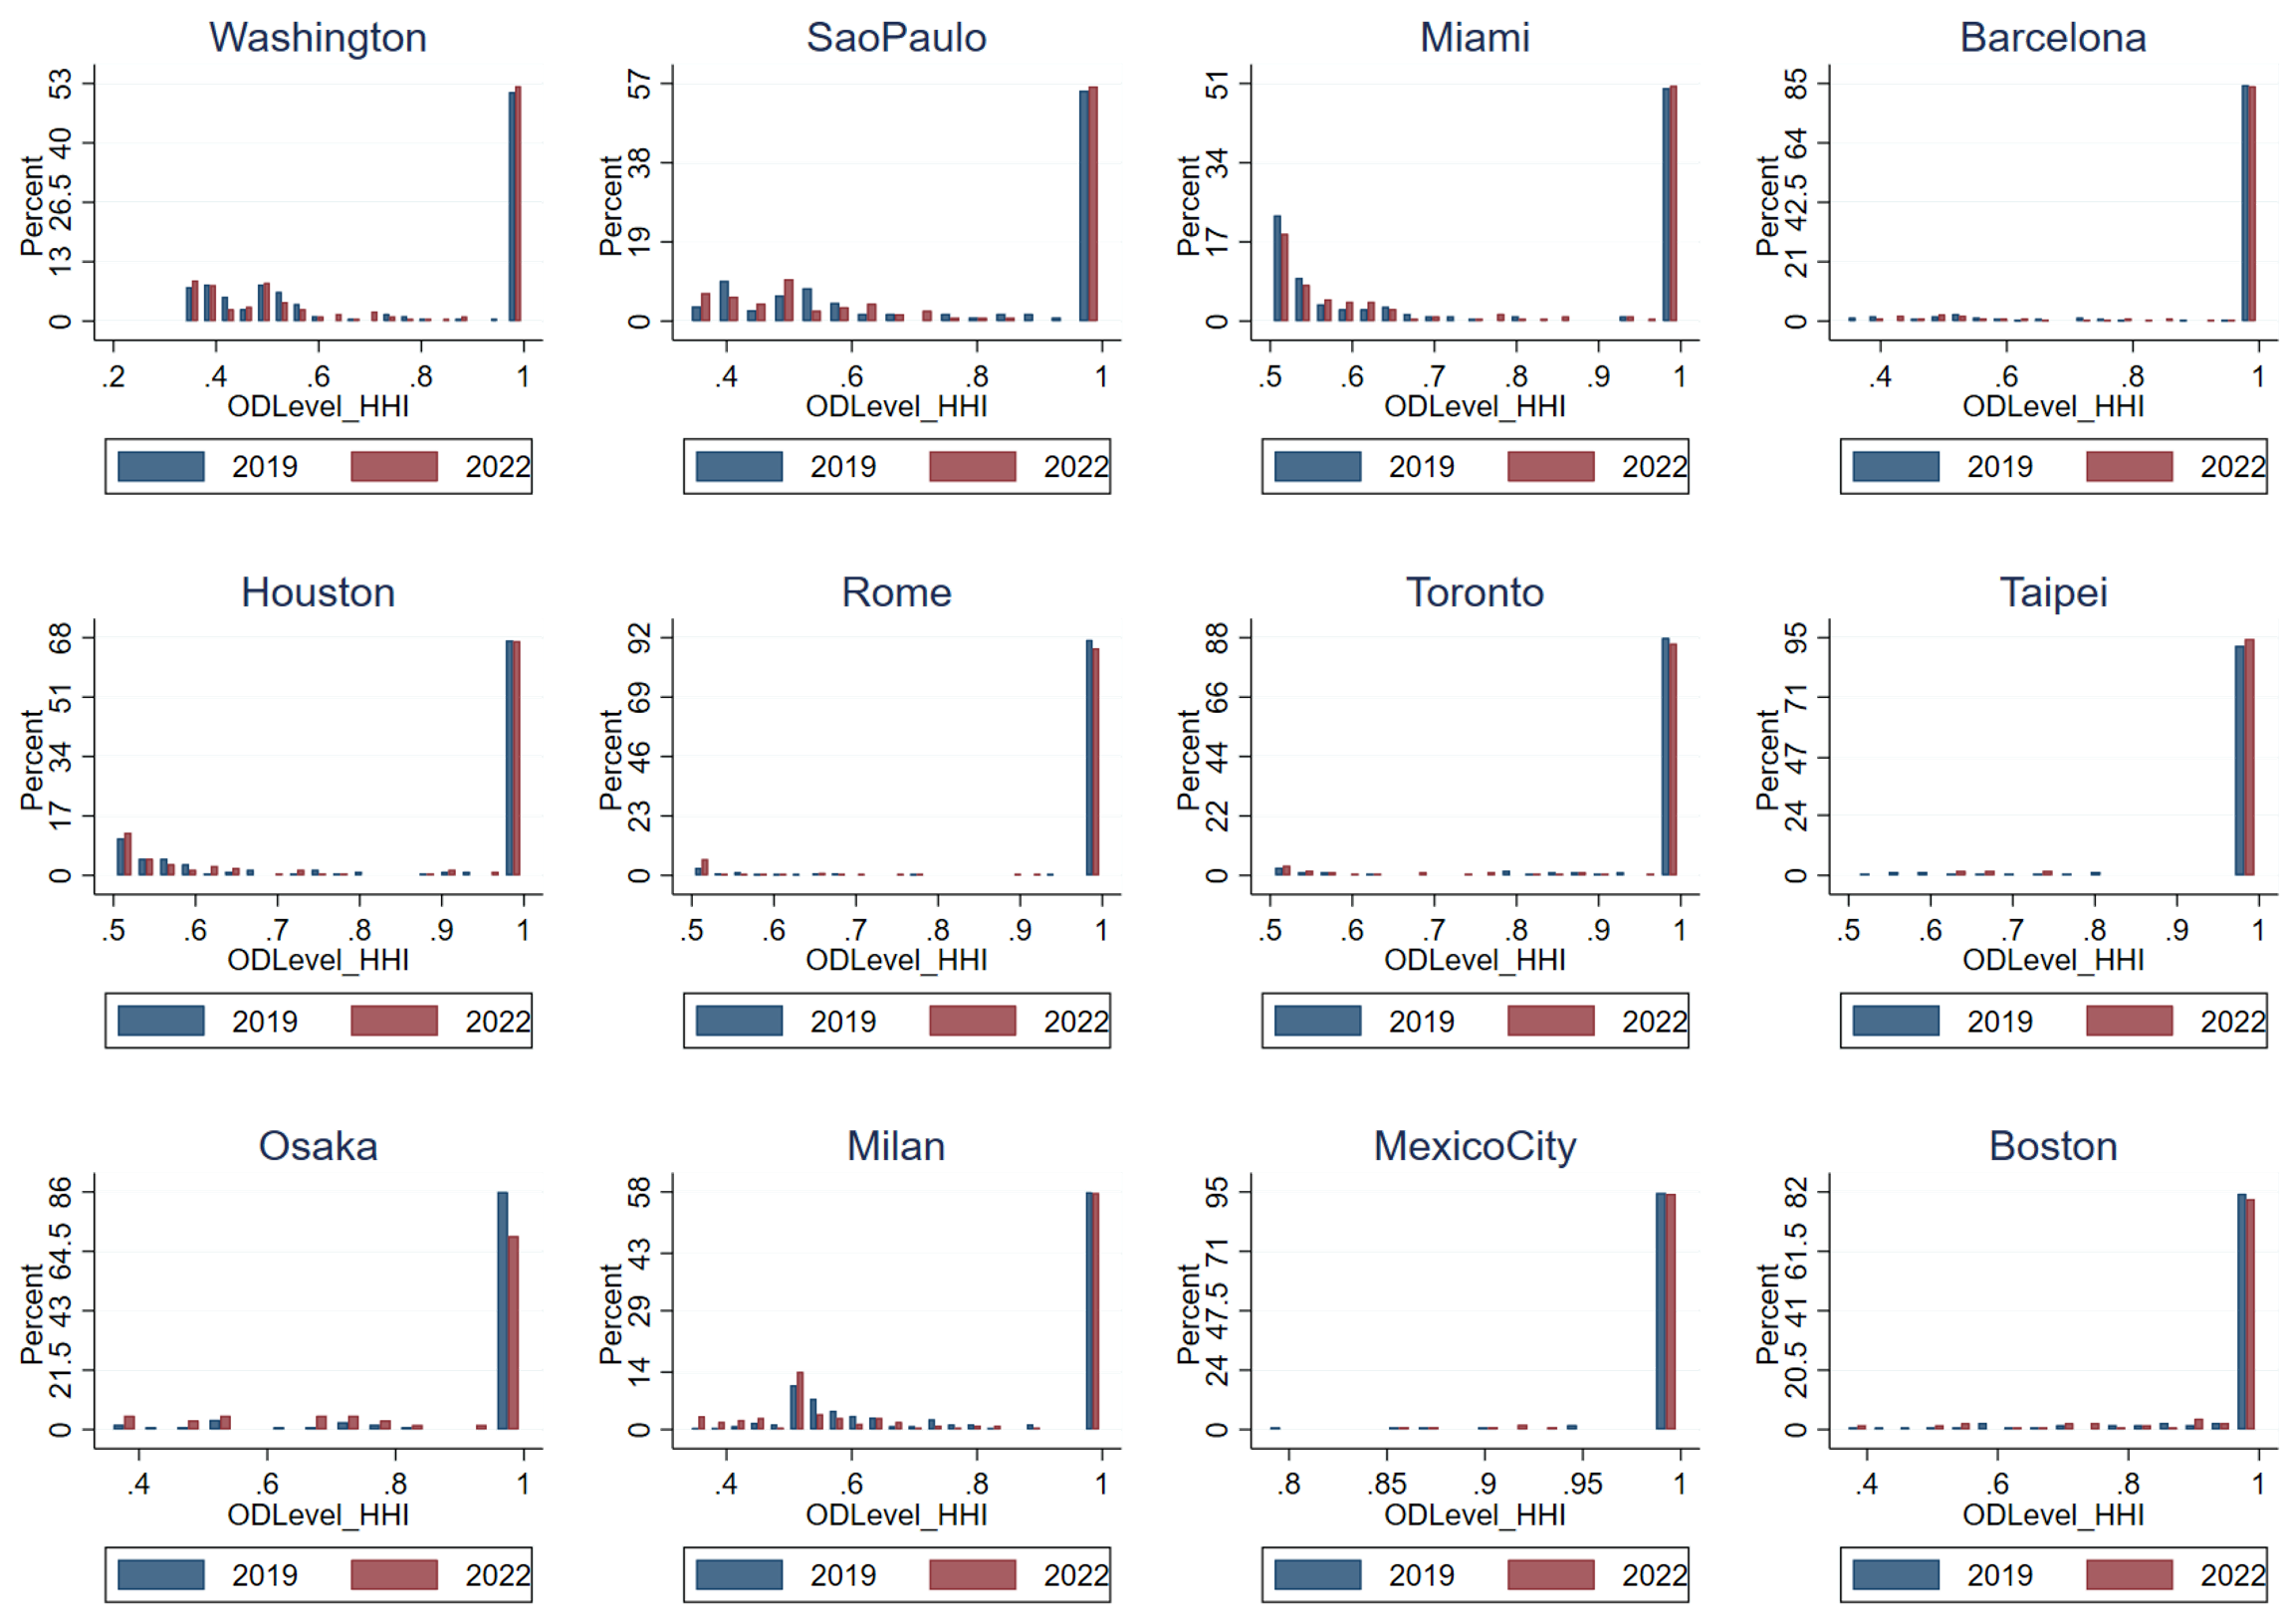
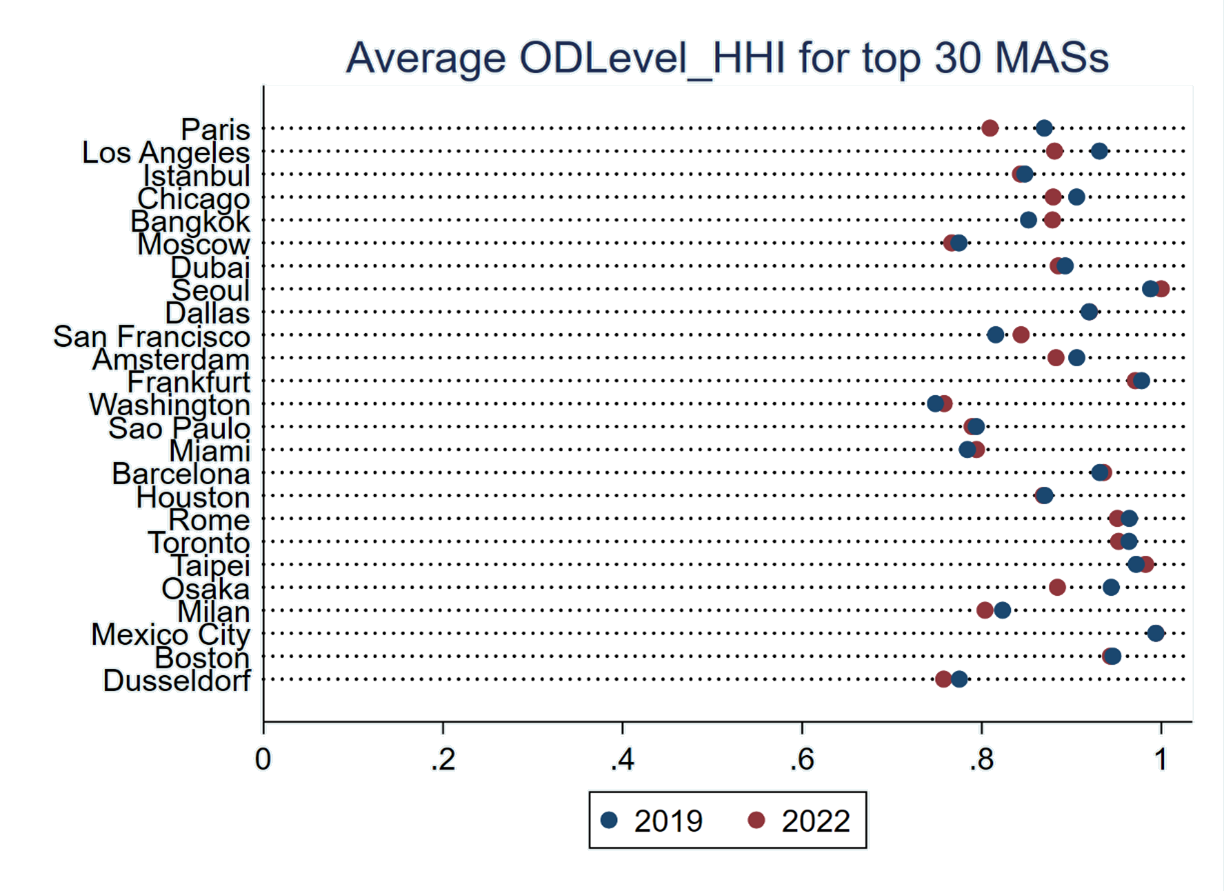
Furthermore, we compiled the distribution of the OD level HHI and
average OD level HHI before and during the late stage of the pandemic
for other sampled MASs and we present the results for the top 30 MASs in
Figures 3 and 4. Overall, the observations indicate that for US and
European MASs, once travel bans were lifted, the intra-MAS airport
competition structure returned to pre-pandemic levels. In contrast, for
Asian Pacific MASs, intra-MAS airport competition could be significantly
reshaped because relevant airports operations had been significantly
constrained by strict international air travel bans.
Figure 1: The distribution of OD HHI for top 5 MAS before
(Q3 2019) and during late stage of pandemic (Q3 2022). Figure 2: The Average OD HHI for top 5 MASs before (Q3 2019)
and during late stage of pandemic (Q3 2022).
4.3 Airline competition within the
MAS
In this subsection, we examine the impact of the pandemic on
airline-level competition within MASs. First, to measure the overall
airline competition intensity, we calculate the airline HHI in each MAS
using the following equation. Airline\_HHI_M = ålimits_i=1N
((q_iM Q_M )2 where qiM is
the scheduled seats of airline i in MAS M, regardless of airport; QM is the total
scheduled seats in MAS M; and
N is the number of airlines in
MAS M. A larger value of
airline HHI suggests more dominance of particular airlines within one
MAS. Table 6 summarizes the airline HHIs for the top 10 MASs before and
during the late stage of the pandemic. For US and European MASs, the
airline HHI did not change significantly. This outcome suggests that
there were no significant airline exits in these MASs during the
pandemic. While some airlines might have exited the market in the early
stages of the pandemic, once it was under control and most travel bans
were lifted, airline services resumed quickly, leading to similar
airline concentration levels. In contrast, for Asia-Pacific MASs, the
concentration level of airlines increased significantly, with some
airlines becoming much more dominant during the pandemic. One possible
explanation is the crowding effect imposed by large-sized dominant
airlines. Since international flight services were largely suspended,
airlines that previously served international markets redeployed their
capacity in domestic markets, intensifying competition and leading to
exits by small airlines and LCCs. The MASs thus became more
concentrated. We also compiled the airline HHI results for other MASs in
Appendix Table 10. Notably, for small-scale MASs, such as Milan, Venice,
and Bologna, their airline HHIs also increased significantly due to
economies of scale. With air traffic dropping during the pandemic, it
was difficult for all airlines to achieve efficient operations, and some
inefficient airlines exited the market, leading to a higher airline
HHI.
Table 6: Airline HHI of top 10 MASs before (Q3 2019) and during late
stage of pandemic (Q3 2022)
Rank
MAS
Before
Late stage
Diff%
1
London
0.118
0.115
-3%
2
New York
0.139
0.151
9%
3
Tokyo
0.183
0.235
28%
4
Hong Kong
0.079
0.123
55%
5
Shanghai
0.125
0.155
24%
6
Paris
0.176
0.177
0%
7
Los Angeles
0.118
0.124
5%
8
Istanbul
0.456
0.486
6%
9
Chicago
0.238
0.234
2%
10
Bangkok
0.080
0.080
0%
Notes:
l. The “before" represents the Q3 of 2019, and "late stage" represents
Q3 of 2022. For Hong Kong
MAS, it only constitutes Hong Kong and Shenzhen airports.
2.The rank of the airports are defined by the total scheduled seats of
the MAS at Q3, 2019.
In addition to overall airline concentration, we also investigated
competition between FSCs and LCCs in MASs. In some MASs, FSCs and LCCs
prefer to have hubs at different airports. For example, in the London
MAS, British Airways (FSC) has its hub at Heathrow Airport, while
Easyjet has its main base at Gatwick Airport. In other MASs, FSCs and
LCCs are not clearly distinguished in hub airports. For instance, in the
Shanghai MAS, Spring Airlines (a LCC) and China Eastern Airlines (a FSC)
claim hubs at both Hongqiao and Pudong airports. Spring Airlines aims to
enter both airports to attract passengers with different airport
preferences in the MAS, but doing so could hinder their achievement of
economies of scale. The pandemic might have affected the incentives of
FSCs and LCCs to choose airport entry and capacity distribution in the
MAS. Thus, we calculated the Gini index of LCC capacity share, and the
results for the top 10 MASs are shown in Table 7. First, for European
and US MASs, the LCC capacity share became slightly more balanced during
the pandemic, as indicated by an overall decrease in the Gini index.
This outcome suggests that LCCs preferred to maintain the presence at
multiple airports in MASs to serve passengers that have different
airport preferences. This is probably due to LCCs’ significant market
shares and traffic volumes, which enable them to maintain sizeable
operations at multiple airports. This is helped by the fact that LCCs
offer simplified services (e.g. no connection nor complicated baggage
handling, simple catering services), thus not too costly to maintain
operations at multiple airports.
However, for Asia-Pacific MASs, particularly the Shanghai MAS, LCCs
preferred to concentrate operations in a single airport, Pudong Airport,
during the pandemic. There are two possible rationales for this choice.
First, LCCs have a much smaller presence and market occupation in China
and Japan, especially in China (no more than 15%). Therefore, it is
crucial for them to have sufficient traffic to achieve economies of
scale, especially when many input prices are beyond the control of LCCs
(Fu et al. 2015b; Su et al. 2020). When the market is in a downturn and
the traffic volume is low, LCCs must consolidate traffic into one
airport in the MAS to maintain a certain level of operational scale. Our
data show that Chinas largest LCC, Spring Airlines, increased its market
share at Pudong Airport more than at Hongqiao Airport during the
pandemic. When more idle slots are available for redistribution, LCCs
can acquire them and expand services, in line with Chinas policy
allowing LCCs to obtain new slots and open new routes from major hub
airports (Shanghai and Beijing) during the pandemic as an indirect
measure to support private LCCs in surviving the market downturn (e.g.,
Hou et al., 2021). Second, FSCs in the Asia-Pacific region faced more
restrictive bans on operating international markets, forcing them to
compete more aggressively in the domestic market to survive. They
attempted to prevent LCC expansion in their hub airports by adopting
more aggressive competition strategies, such as deep price discounts.
The Gini index of LCC capacity share for other MASs is available in
Appendix Table 11.
Table 7: Gini index of LCC capacity share in top 10 MASs before (Q3
2019) and during late stage of pandemic (Q3 2022)
Rank
MAS
Before
Late stage
Diff%
1
London
0.461
0.437
-5%
2
New York
0.428
0.379
-11%
3
Tokyo
0.269
0.332
23%
4
Hong Kong
0.148
0.190
28%
5
Shanghai
0.026
0.069
169%
6
Paris
0.321
0.290
-10%
7
Los Angeles
0.247
0.209
-15%
8
Istanbul
0.467
0.489
5%
9
Chicago
0.309
0.296
-4%
10
Bangkok
0.385
0.282
-27%
Notes:
l. The “before" represents the Q3 of 2019, and "late stage" represents
Q3 of 2022. For Hong Kong
MAS, it only constitutes Hong Kong and Shenzhen airports.
2.The rank of the airports are defined by the total scheduled seats of
the MAS at Q3, 2019.
5 Conclusions
This study first reviewed and summarized the recent literature on
MASs, discussing the main research topics and development patterns. It
is noted that the impacts of the pandemic on MASs have not been well
explored in the literature. Therefore, we collected
airport-airline-specific capacity data from OAG (before and during the
late stage of the pandemic) to examine the pandemics impact on different
dimensions of MAS operations worldwide following the definitions used in
previous studies for consistency. A total of 53 MASs are included in our
sample, with a focus on the top MASs around the world. By calculating
descriptive statistics and indices, we studied three dimensions of MAS
structures before and during the late stage of the pandemic: i) traffic
and degree centrality distributions within MASs; ii) intra-MAS airport
competition (the degree of OD market overlap); and iii) airline
competition intensity within MASs.
Our statistics suggest heterogeneous impacts of the pandemic on MASs
in different regions when comparing market outcomes between Q3 2019
(before the pandemic) and Q3 2022 (during the pandemic). For MASs in the
US and Europe, the distribution of traffic and degree centrality among
airports remained largely unchanged. Both the domestic and international
airline markets in these MASs have returned to pre-pandemic levels at
similar paces. Until the end of 2022, intra-MAS airport competition and
airline airport dominance and concentration (including between FSCs and
LCCs) have also been similar to pre-pandemic levels at major European
and US MASs. These results suggest the stability of MAS structures in
the US and Europe after their airline markets recovered from the
unprecedented shock of the pandemic.
In contrast, Asia-Pacific MASs experienced significant changes during
the pandemic, mainly due to very restrictive bans on international
travel. Since large-sized airlines could not serve international
markets, they had to redeploy their capacity into domestic markets,
leading to significant changes in the MAS structure. First, airport
traffic could be more balanced within the MAS, and intra-MAS airport
competition became much fiercer as airports focused on operations in
similar domestic destinations. On the other hand, smaller airlines
dropped quite a few markets, leading to higher airline concentration
levels. The net effect (i.e. whether competition in an MAS increased and
decreased) remains unclear. It is also noted that LCCs in Asia-Pacific
seemed more likely to have a main base in a single airport in one MAS,
either due to the incentive of achieving economies of scale or they were
pushed out from other airports due to stronger competitive responses
from FSCs who were forced to allocate more capacity to domestic
markets.
In general, our study identified heterogeneous development and
recovery patterns among MASs in different regions. Although some
possible explanations are proposed, more in-depth analysis is required
to go beyond simple statistics. Our study also raised some questions
unanswered. For example, government interventions in the European and
North American markets, where market largely returned to pre-pandemic
conditions, are probably not necessary. Yet it is not clear whether the
any government intervention should be considered to address the
heterogeneous impacts caused by the pandemic, especially for
“distortions” caused by previous regulations (e.g. ban on international
services). Extension studies based on updated data can be helpful in
addressing those important questions.
References
Babić, D., Kalić, M., Janić, M., Dožić, S., & Kukić, K. (2022).
Integrated Door-to-Door Transport Services for Air Passengers: From
Intermodality to Multimodality. Sustainability, 14(11), 6503.
Bezerra, G. C., & Gomes, C. F. (2019). Determinants of passenger
loyalty in multi-airport regions: Implications for tourism
destination. Tourism Management Perspectives, 31, 145-158.
Bonnefoy, P. A., de Neufville, R., & Hansman, R. J. (2010).
Evolution and development of multiairport systems: Worldwide
perspective. Journal of Transportation Engineering, 136(11),
1021-1029.
Brueckner, J. K. (2003). Airline traffic and urban economic
development. Urban Studies, 40(8), 1455-1469.
Chen, T., Fu, X., Hensher, D. A., Li, Z. C., & Sze, N. N.
(2022a). Air travel choice, online meeting and passenger
heterogeneity–An international study on travellers’ preference during a
pandemic. Transportation Research Part A: Policy and Practice, 165,
439-453.
Chen, T., Fu, X., Hensher, D., Li, Z.C., Sze, N.N., (2022b), The
effect of online meeting and health screening on business travel: a
stated preference case study in Hong Kong, Transportation Research -
Part E , 164, 102823.
Cheung, T. K.-Y., Wong, W.-h., Zhang, A., & Wu, Y. (2020).
Spatial panel model for examining airport relationships within
multi-airport regions. Transportation Research Part A: Policy and
Practice, 133, 148-163.
Chiambaretto, P., Baudelaire, C., & Lavril, T. (2013). Measuring
the willingness-to-pay of air-rail intermodal passengers. Journal of Air
Transport Management, 26, 50-54.
Czerny, A. I., Fu, X., Lei, Z., & Oum, T. H. (2021). Post
pandemic aviation market recovery: Experience and lessons from
China. Journal of Air Transport Management, 90, 101971.
de Neufville, R. (2004). The Future of Secondary Airports: Nodes of a
parallel air transport network?
de Neufville, R. (2016). Multi-Airport Systems. Istanbul Technical
University. Air Transportation Management. Airport Planning and
Management. Module 24.
de Paula Balan, B., da Cunha, M. C. F., da Cunha, R. C., &
Halawi, L. (2022) Aviation supply and demand in the São Paulo and Rio de
Janeiro systems evolution: An exploratory study. Journal of Economics
and Management, 44(1), 393-419.
Fu, X., Dresner, M. & Oum, T.H. (2011), Effects of transport
service differentiation in the U.S. domestic airline market,
Transportation Research – Part E 47(3), 297-305.
Fu X., Lei Z., Wang K. and Yan J. (2015b), Low cost carrier
competition and route entry in an emerging but regulated aviation market
- the Case of China, Transportation Research - Part A, 79, 3-16.
Fu, X., Jin, H., Liu, S., Oum, T.H., & Yan, J. (2019) Exploring
network effects of Point-to-Point networks: An investigation of the
spatial patterns of Southwest airlines’ network, Transport Policy, 76,
36-45.
Fu X., Oum T.H., Chen R. & Lei Z. (2015a), Dominant carrier
performance and international liberalization – the case of North East
Asia, Transport Policy, 43, 61–75.
Fuellhart, K., O’Connor, K., & Woltemade, C. (2013). Route-level
passenger variation within three multi-airport regions in the
USA. Journal of Transport Geography, 31, 171-180.
Harvey, G. (1987). Airport choice in a multiple airport
region. Transportation Research Part A: General, 21(6), 439-449.
Hess, S., & Polak, J. W. (2006). Exploring the potential for
cross-nesting structures in airport-choice analysis: a case-study of the
Greater London area. Transportation Research Part E: Logistics and
Transportation Review, 42(2), 63-81.
Hou, M., Wang, K., & Yang, H. (2021). Hub airport slot
Re-allocation and subsidy policy to speed up air traffic recovery amid
COVID-19 pandemic---case on the Chinese airline market. Journal of Air
Transport Management, 93, 102047.
Hou, M., Wang, K., Yang, H., & Zhang, A. (2022). Airport-airline
Relationship, Competition and Welfare in a Multi-airport System: The
Case of New Beijing Daxing Airport. Journal of Transport Economics and
Policy (JTEP), 56(2), 156-189.
Jung, S.-Y., & Yoo, K.-E. (2016). A study on passengers airport
choice behavior using hybrid choice model: A case study of Seoul
metropolitan area, South Korea. Journal of Air Transport Management, 57,
70-79.
Kuo, P.-F., Putra, I. G. B., Setiawan, F. A., Wen, T.-H., Chiu,
C.-S., & Sulistyah, U. D. (2022). The impact of the COVID-19
pandemic on OD flow and airport networks in the origin country and in
Northeast Asia. Journal of Air Transport Management, 100, 102192.
Li, L. Y., Mao, Y. J., Wang, Y., & Ma, Z. H. (2022). How has
airport service quality changed in the context of COVID-19: A
data-driven crowdsourcing approach based on sentiment analysis. Journal
of Air Transport Management, 105.
Li, S. P., Zhou, Y. M., Kundu, T., & Sheu, J. B. (2021).
Spatiotemporal variation of the worldwide air transportation network
induced by COVID-19 pandemic in 2020. Transport Policy, 111,
168-184.
Li, X., Tang, J., Hu, X., & Wang, W. (2020). Assessing intercity
multimodal choice behavior in a Touristy City: A factor analysis.
Journal of Transport Geography, 86, 102776.
Li, Z.-C., Tu, N., Fu, X., & Sheng, D. (2022). Modeling the
effects of airline and high-speed rail cooperation on multi-airport
systems: The implications on congestion, competition and social welfare.
Transportation Research Part B-Methodological, 155, 448-478.
Liao, W., Cao, X., & Li, S. (2019). Competition and
Sustainability Development of a Multi-Airport Region: A Case Study of
the Guangdong-Hong Kong-Macao Greater Bay Area. Sustainability,
11(10).
Liao, W., Cao, X., Liu, Y., & Huang, Y. (2022). Investigating
differential effects of airport service quality on behavioral intention
in the multi-airport regions. Research in Transportation Business &
Management, 45, 100877.
Ma, G. F., Ding, Y., & Ma, J. Y. (2022). The Impact of Airport
Physical Environment on Perceived Safety and Domestic Travel Intention
of Chinese Passengers during the COVID-19 Pandemic: The Mediating Role
of Passenger Satisfaction. Sustainability, 14(9).
Mamdoohi, A. R., Yazdanpanah, M., Taherpour, A., & Saffarzadeh,
M. (2014). An analysis of resident and Non-resident air passenger
behaviour of origin airport choice. International Journal of
Transportation Engineering, 2(1), 13-30.
Marcucci, E., & Gatta, V. (2011). Regional airport choice:
Consumer behaviour and policy implications. Journal of Transport
Geography, 19(1), 70-84.
Marcucci, E., & Gatta, V. (2012). Dissecting preference
heterogeneity in consumer stated choices. Transportation Research Part
E: Logistics and Transportation Review, 48(1), 331-339.
Monmousseau, P., Marzuoli, A., Feron, E., & Delahaye, D. (2020).
Impact of Covid-19 on passengers and airlines from passenger
measurements: Managing customer satisfaction while putting the US Air
Transportation System to sleep. Transportation Research
Interdisciplinary Perspectives, 7, 100179.
Mueller, F. (2022). Examining COVID-19-triggered changes in spatial
connectivity patterns in the European air transport network up to June
2021. Research in Transportation Economics, 94, 101127.
Murça, M. C. R., & Correia, A. R. (2013). Análise da modelagem da
escolha aeroportuária em regiões de múltiplos aeroportos.
[Analysis of airport choice modeling in multi-airport
regions]. Journal of Transport Literature, 7(4),
130-146.
Nižetić, S. (2020). Impact of coronavirus (COVID‐19) pandemic on air
transport mobility, energy, and environment: A case study. International
Journal of Energy Research, 44(13), 10953-10961.
Noruzoliaee, M., Zou, B., & Zhang, A. (2015). Airport partial and
full privatization in a multi-airport region: Focus on pricing and
capacity. Transportation Research Part E: Logistics and Transportation
Review, 77, 45-60.
Ng, K. T., Fu, X., Hanaoka, S., & Oum, T. H. (2022). Japanese
aviation market performance during the COVID-19 pandemic-Analyzing
airline yield and competition in the domestic market. Transport
Policy, 116, 237-247.
Paliska, D., Drobne, S., Borruso, G., Gardina, M., & Fabjan, D.
(2016). Passengers airport choice and airports catchment area analysis
in cross-border Upper Adriatic multi-airport region. Journal of Air
Transport Management, 57, 143-154.
Pels, E., Nijkamp, P., & Rietveld, P. (2000). Airport and airline
competition for passengers departing from a large metropolitan area.
Journal of Urban Economics, 48(1), 29-45.
Pels, E., Nijkamp, P., & Rietveld, P. (2001). Airport and airline
choice in a multiple airport region: an empirical analysis for the San
Francisco Bay Area. Regional Studies, 35(1), 1-9.
Pels, E., Nijkamp, P., & Rietveld, P. (2003). Access to and
competition between airports: a case study for the San Francisco Bay
area. Transportation Research Part A: Policy and Practice, 37(1),
71-83.
Salesi, V. K., Tsui, W. H. K., Fu, X., & Gilbey, A. (2022).
Strategies for South Pacific Region to address future pandemics:
Implications for the aviation and tourism sectors based on a systematic
literature review (2010–2021). Transport Policy.
Shamohammadi, M., Park, Y., Choi, J. H., & Kwon, O. K. (2022).
Exploring the Performance of International Airports in the Pre- and
Post-COVID-19 Era: Evidence from Incheon International Airport.
Sustainability, 14(7).
Sheard, N. (2014). Airports and urban sectoral employment. Journal of
Urban Economics, 80, 133-152.
Su, M., Luan, W., Fu, X., Yang, Z., Zhang, R. (2020) The competition
effects of low-cost carriers and high-speed rail on the Chinese aviation
market, Transport Policy, 95, 37-46.
Sun, X., Wandelt, S., Hansen, M., & Li, A. (2017). Multiple
airport regions based on inter-airport temporal distances.
Transportation Research Part E: Logistics and Transportation Review,
101, 84-98.
Sun, X., Wandelt, S., & Zhang, A. (2020). How did COVID-19 impact
air transportation? A first peek through the lens of complex networks.
Journal of Air Transport Management, 89, 101928.
Sun, X., Wandelt, S., & Zhang, A. (2021b). On the degree of
synchronization between air transport connectivity and COVID-19 cases at
worldwide level. Transport Policy, 105, 115-123.
Sun, X., Wandelt, S., Zheng, C., & Zhang, A. (2021a). COVID-19
pandemic and air transportation: Successfully navigating the paper
hurricane. Journal of Air Transport Management, 94, 102062.
Sun, X., Wandelt, S., & Zhang, A. (2022). COVID-19 pandemic and
air transportation: Summary of Recent Research, Policy Consideration and
Future Research Directions. Transportation Research Interdisciplinary
Perspectives, 16, 100718.
Suzumura, T., Kanezashi, H., Dholakia, M., Ishii, E., Napagao, S. A.,
Pérez-Arnal, R., & Garcia-Gasulla, D. (2020). The impact of COVID-19
on flight networks. In 2020 IEEE International Conference on Big Data
(Big Data) (pp. 2443-2452). IEEE.
Teixeira, F. M., & Derudder, B. (2021). Spatio-temporal dynamics
in airport catchment areas: The case of the New York Multi Airport
Region. Journal of Transport Geography, 90, 102916.
Tiglao, N. C. Investigating Tourists’ Airport Choice in the
Multi-Airport Region of Aklan, Philippines and Its Implications on
Airport Capacity Expansion Decisions. Transport, 3(1).
Tu, N., Li, Z.C., Fu, X., Lei, Z. (2020). Airline network competition
in inter-continental market. Transportation Research - Part E, 143,
102117.
Wang K., Gong Q., Fu X. and Fan X. (2014), Frequency and aircraft
size dynamics in a concentrated growth market: The case of the Chinese
domestic market, Journal of Air Transport Management, 36, 50–58.
Wang, K., Tsui, K., Li, L.B., Lei, Z., Fu, X. (2020b) Entry pattern of
low-cost carriers in New Zealand - The impact of domestic and
trans-Tasman market factors, Transport Policy, 93, 36-45.
Wang, K., Jiang, C., Ng, A. K., & Zhu, Z. (2020a). Air and rail
connectivity patterns of major city clusters in China. Transportation
Research Part A: Policy and Practice, 139, 35-53.
Wong, W. H., Cheung, T., Zhang, A., & Wang, Y. (2019a). Is
spatial dispersal the dominant trend in air transport development? A
global analysis for 2006-2015. Journal of Air Transport Management, 74,
1-12.
Wong, W.-H., Zhang, A., Cheung, T. K.-Y., & Chu, J. (2019b).
Examination of low-cost carriers development at secondary airports using
a comprehensive world airport classification. Journal of Air Transport
Management, 78, 96-105.
Winston, C., & Yan, J. (2011). Can privatization of US highways
improve motorists welfare?. Journal of Public Economics, 95(7-8),
993-1005.
Yan, J., & Winston, C. (2014). Can private airport competition
improve runway pricing? The case of San Francisco Bay area airports.
Journal of Public Economics, 115, 146-157.
Zhang, A. (1996) An analysis of fortress hubs in airline networks,
Journal of Transport Economics and Policy, 30(3), 293-307.
Zhang, L., Hou, M., Liu, Y., Wang, K., & Yang, H. (2022). Measuring Beijing's international air connectivity and suggestions for improvement post COVID-19. Transport Policy, 116, 132-143.
Zhang, L., Yang, H., Wang, K., Bian, L., & Zhang, X. (2021). The
impact of COVID-19 on airline passenger travel behavior: An exploratory
analysis on the Chinese aviation market. Journal of Air Transport
Management, 95, 102084.
Zhang, Y., Zhang, A., & Wang, J. (2020). Exploring the roles of
high-speed train, air and coach services in the spread of COVID-19 in
China. Transport Policy, 94, 34-42.
Appendix
Table 8: Gini index of the degree centrality before (Q3 2019) and during
late stage of pandemic (Q3 2022) for MASs (other than top 10
MASs)
Domestic
International
Rank
MAS
Region
Before
Late stage
Diff%
Before
Late stage
Diff%
11
Moscow
Europe
0.017
0.038
118%
0.116
0.08
-31%
12
Dubai
Latin America & Middle East
0
0
NA
0.223
0.224
0%
13
Seoul
Asia-Pacific
0.25
0.389
56%
0.464
0.48
3%
14
Dallas
North America
0.256
0.226
-12%
0.5
0.5
0%
15
San Francisco
North America
0.138
0.214
55%
0.387
0.437
13%
16
Amsterdam
Europe
0.133
0
-100%
0.389
0.345
-11%
17
Frankfurt
Europe
0.5
0.5
0%
0.395
0.38
-4%
18
Washington
North America
0.04
0.053
34%
0.438
0.433
-1%
19
Sao Paulo
Latin America & Middle East
0.106
0.164
55%
0.583
0.623
7%
20
Miami
North America
0.087
0.007
-92%
0.145
0.147
2%
21
Barcelona
Europe
0.667
0.586
-12%
0.403
0.426
6%
22
Houston
North America
0.18
0.15
-17%
0.359
0.361
1%
23
Rome
Europe
0.462
0.423
-8%
0.281
0.33
17%
24
Toronto
North America
0.381
0.292
-23%
0.603
0.604
0%
25
Taipei
Asia-Pacific
0.5
0.5
0%
0.407
0.442
9%
26
Osaka
Asia-Pacific
0.294
0.226
-23%
0.667
0.667
0%
27
Milan
Europe
0.026
0.062
137%
0.32
0.267
-17%
28
Mexico City
Latin America & Middle East
0.398
0.357
-10%
0.5
0.5
0%
29
Boston
North America
0.381
0.384
1%
0.642
0.667
4%
30
Dusseldorf
Europe
0.513
0.437
-15%
0.352
0.307
-13%
31
Orlando
North America
0.051
0.057
11%
0.312
0.438
40%
32
Manchester
Europe
0.292
0.232
-20%
0.278
0.271
-3%
33
Vienna
Europe
0.5
0.3
-40%
0.272
0.302
11%
34
Brussels
Europe
0
0
NA
0.383
0.319
-17%
35
Detroit
North America
0.451
0.394
-13%
0.5
0.433
-13%
36
Melbourne
Asia-Pacific
0.409
0.435
6%
0.477
0.5
5%
37
Copenhagen
Europe
0.167
0.125
-25%
0.405
0.377
-7%
38
San Diego
North America
0.142
0.132
-7%
0.318
0.5
57%
39
Philadelphia
North America
0.444
0.418
-6%
0.5
0.467
-7%
40
Oslo
Europe
0.372
0.353
-5%
0.309
0.284
-8%
41
Stockholm
Europe
0.419
0.396
-6%
0.484
0.59
22%
42
Vancouver
North America
0.304
0.394
29%
0.485
0.5
3%
43
Glasgow
Europe
0.346
0.349
1%
0.363
0.411
13%
44
Buenos Aires
Latin America & Middle East
0.255
0.11
-57%
0.456
0.125
-73%
45
Rio De Janeiro
Latin America & Middle East
0.095
0.056
-42%
0.5
0.5
0%
46
Tampa
North America
0.188
0.116
-38%
0.615
0.476
-23%
47
Tehran
Latin America & Middle East
0.5
0.5
0%
0.5
0.479
-4%
48
Stuttgart
Europe
0.357
0.389
9%
0.26
0.223
-14%
49
Venice
Europe
0.111
0.382
244%
0.23
0.142
-38%
50
Cleveland
North America
0.339
0.266
-21%
0.5
0.5
0%
51
Pisa
Europe
0.269
0.188
-30%
0.216
0.228
6%
52
Belfast
Europe
0.052
0.094
81%
0.438
0.469
7%
53
Norfolk
North America
0.403
0.474
18%
0
0
NA
Notes:
1.The “before” represents the Q3 of 2019, and “late stage” represents Q3
of 2022.
2.The rank of the airports are defined by the total scheduled seats of
the MAS at Q3, 2019.
Table 9: Gini index of the traffic before (Q3 2019) and during late
stage of pandemic (Q3 2022) for MASs (other than top 10 MASs)
Domestic
International
Rank
MAS
Region
Before
Late stage
Diff%
Before
Late stage
Diff%
11
Moscow
Europe
0.155
0.201
30%
0.276
0.034
-88%
12
Dubai
Latin America & Middle East
0
0
NA
0.384
0.359
-7%
13
Seoul
Asia-Pacific
0.465
0.5
8%
0.444
0.484
9%
14
Dallas
North America
0.287
0.288
0%
0.5
0.5
0%
15
San Francisco
North America
0.274
0.222
-19%
0.569
0.606
7%
16
Amsterdam
Europe
0.552
0.173
-69%
0.568
0.543
-4%
17
Frankfurt
Europe
0.5
0.5
0%
0.481
0.472
-2%
18
Washington
North America
0.108
0.128
19%
0.528
0.527
0%
19
Sao Paulo
Latin America & Middle East
0.198
0.151
-24%
0.618
0.612
-1%
20
Miami
North America
0.057
0.047
-17%
0.189
0.215
14%
21
Barcelona
Europe
0.667
0.662
-1%
0.574
0.571
-1%
22
Houston
North America
0.192
0.194
1%
0.438
0.418
-5%
23
Rome
Europe
0.486
0.473
-3%
0.382
0.4
5%
24
Toronto
North America
0.551
0.547
-1%
0.632
0.634
0%
25
Taipei
Asia-Pacific
0.5
0.5
0%
0.441
0.467
6%
26
Osaka
Asia-Pacific
0.317
0.298
-6%
0.667
0.667
0%
27
Milan
Europe
0.335
0.15
-55%
0.444
0.293
-34%
28
Mexico City
Latin America & Middle East
0.478
0.479
0%
0.5
0.5
0%
29
Boston
North America
0.542
0.543
0%
0.661
0.667
1%
30
Dusseldorf
Europe
0.524
0.567
8%
0.492
0.456
-7%
31
Orlando
North America
0.432
0.444
3%
0.467
0.494
6%
32
Manchester
Europe
0.385
0.279
-27%
0.447
0.454
2%
33
Vienna
Europe
0.5
0.497
-1%
0.428
0.431
1%
34
Brussels
Europe
0
0
NA
0.511
0.466
-9%
35
Detroit
North America
0.484
0.482
0%
0.5
0.499
0%
36
Melbourne
Asia-Pacific
0.471
0.48
2%
0.462
0.5
8%
37
Copenhagen
Europe
0.116
0.193
67%
0.47
0.468
0%
38
San Diego
North America
0.241
0.152
-37%
0.416
0.5
20%
39
Philadelphia
North America
0.472
0.459
-3%
0.5
0.494
-1%
40
Oslo
Europe
0.466
0.468
1%
0.411
0.403
-2%
41
Stockholm
Europe
0.473
0.51
8%
0.586
0.631
8%
42
Vancouver
North America
0.424
0.414
-2%
0.498
0.5
0%
43
Glasgow
Europe
0.384
0.341
-11%
0.371
0.415
12%
44
Buenos Aires
Latin America & Middle East
0.414
0.329
-21%
0.471
0.172
-63%
45
Rio De Janeiro
Latin America & Middle East
0.102
0.315
208%
0.5
0.5
0%
46
Tampa
North America
0.508
0.458
-10%
0.666
0.654
-2%
47
Tehran
Latin America & Middle East
0.5
0.5
0%
0.5
0.5
0%
48
Stuttgart
Europe
0.463
0.48
4%
0.391
0.347
-11%
49
Venice
Europe
0.172
0.426
148%
0.355
0.282
-21%
50
Cleveland
North America
0.426
0.448
5%
0.5
0.5
0%
51
Pisa
Europe
0.265
0.32
21%
0.128
0.102
-21%
52
Belfast
Europe
0.09
0.091
1%
0.437
0.457
5%
53
Norfolk
North America
0.405
0.467
15%
0
0
NA
Notes:
1.The “before” represents the Q3 of 2019, and “late stage” represents Q3
of 2022.
2.The rank of the airports are defined by the total scheduled seats of
the MAS at Q3, 2019.
Figure 3: The distribution of OD HHI in top 29 MASs before (Q3 2019)
and during late stage of pandemic (Q3 2022) (other than top 5
MASs)Figure 4: The Average OD level HHI for top 30 MASs before (Q3 2019)
and during late stage of pandemic (Q3 2022) (other than top 5
MASs)
Table 10: Airline HHI of MASs before (Q3 2019) and during late stage of
pandemic (Q3 2022) (other than top 10 MASs)
Rank
MAS
Region
Before
Late stage
Diff%
11
Moscow
Europe
0.205
0.2
-3%
12
Dubai
Latin America & Middle East
0.372
0.282
-24%
13
Seoul
Asia-Pacific
0.119
0.126
6%
14
Dallas
North America
0.504
0.491
-2%
15
San Francisco
North America
0.18
0.196
9%
16
Amsterdam
Europe
0.201
0.203
1%
17
Frankfurt
Europe
0.362
0.334
-8%
18
Washington
North America
0.19
0.197
4%
19
Sao Paulo
Latin America & Middle East
0.274
0.28
2%
20
Miami
North America
0.198
0.211
6%
21
Barcelona
Europe
0.177
0.206
16%
22
Houston
North America
0.372
0.353
-5%
23
Rome
Europe
0.155
0.126
-19%
24
Toronto
North America
0.316
0.267
-15%
25
Taipei
Asia-Pacific
0.108
0.2
84%
26
Osaka
Asia-Pacific
0.095
0.204
115%
27
Milan
Europe
0.107
0.143
35%
28
Mexico City
Latin America & Middle East
0.217
0.283
30%
29
Boston
North America
0.14
0.158
13%
30
Dusseldorf
Europe
0.154
0.15
-3%
31
Orlando
North America
0.106
0.113
7%
32
Manchester
Europe
0.116
0.146
26%
33
Vienna
Europe
0.194
0.264
36%
34
Brussels
Europe
0.156
0.153
-2%
35
Detroit
North America
0.553
0.531
-4%
36
Melbourne
Asia-Pacific
0.187
0.22
18%
37
Copenhagen
Europe
0.147
0.121
-17%
38
San Diego
North America
0.151
0.159
6%
39
Philadelphia
North America
0.46
0.398
-13%
40
Oslo
Europe
0.243
0.217
-11%
41
Stockholm
Europe
0.154
0.127
-18%
42
Vancouver
North America
0.255
0.247
-3%
43
Glasgow
Europe
0.117
0.16
37%
44
Buenos Aires
Latin America & Middle East
0.282
0.301
7%
45
Rio De Janeiro
Latin America & Middle East
0.319
0.273
-15%
46
Tampa
North America
0.155
0.155
0%
47
Tehran
Latin America & Middle East
0.129
0.114
-12%
48
Stuttgart
Europe
0.154
0.181
17%
49
Venice
Europe
0.086
0.143
66%
50
Cleveland
North America
0.164
0.159
-4%
51
Pisa
Europe
0.153
0.201
31%
52
Belfast
Europe
0.298
0.405
36%
53
Norfolk
North America
0.258
0.227
-12%
Notes:
1.The “before” represents the Q3 of 2019, and “late stage” represents Q3
of 2022.
2.The rank of the airports are defined by the total scheduled seats of
the MAS at Q3, 2019.
Table 11: Gini index of LCC capacity share in MASs before (Q3 2019) and
during late stage of pandemic (Q3 2022) (other than top 10
MASs)
Rank
MAS
Region
Before
Late stage
Diff%
11
Moscow
Europe
0.648
0.608
-6%
12
Dubai
Latin America & Middle East
0.341
0.271
-20%
13
Seoul
Asia-Pacific
0.031
0.114
264%
14
Dallas
North America
0.44
0.428
-3%
15
San Francisco
North America
0.329
0.309
-6%
16
Amsterdam
Europe
0.252
0.257
2%
17
Frankfurt
Europe
0.435
0.465
7%
18
Washington
North America
0.467
0.492
5%
19
Sao Paulo
Latin America & Middle East
0.207
0.244
18%
20
Miami
North America
0.464
0.341
-27%
21
Barcelona
Europe
0.084
0.044
-47%
22
Houston
North America
0.42
0.373
-11%
23
Rome
Europe
0.306
0.191
-37%
24
Toronto
North America
0.56
0.58
4%
25
Taipei
Asia-Pacific
0.42
0.5
19%
26
Osaka
Asia-Pacific
0.462
0.407
-12%
27
Milan
Europe
0.412
0.248
-40%
28
Mexico City
Latin America & Middle East
0.172
0.214
24%
29
Boston
North America
0.073
0.148
104%
30
Dusseldorf
Europe
0.15
0.16
6%
31
Orlando
North America
0.103
0.122
18%
32
Manchester
Europe
0.152
0.095
-37%
33
Vienna
Europe
0.238
0.107
-55%
34
Brussels
Europe
0.563
0.564
0%
35
Detroit
North America
0.098
0.299
205%
36
Melbourne
Asia-Pacific
0.204
0.163
-20%
37
Copenhagen
Europe
0.115
0.1
-13%
38
San Diego
North America
0.155
0.152
-2%
39
Philadelphia
North America
0.349
0.305
-12%
40
Oslo
Europe
0.069
0.14
102%
41
Stockholm
Europe
0.515
0.494
-4%
42
Vancouver
North America
0.461
0.432
-6%
43
Glasgow
Europe
0.195
0.123
-37%
44
Buenos Aires
Latin America & Middle East
0.076
0.065
-15%
45
Rio De Janeiro
Latin America & Middle East
0.033
0.122
266%
46
Tampa
North America
0.239
0.155
-35%
47
Tehran
Latin America & Middle East
0.5
0.5
0%
48
Stuttgart
Europe
0.135
0.135
0%
49
Venice
Europe
0.172
0.124
-28%
50
Cleveland
North America
0.278
0.116
-58%
51
Pisa
Europe
0.261
0.174
-33%
52
Belfast
Europe
0.5
0.404
-19%
53
Norfolk
North America
0.5
0.5
0%
Notes:
1.The “before” represents the Q3 of 2019, and “late stage” represents Q3
of 2022.
2.The rank of the airports are defined by the total scheduled seats of
the MAS at Q3, 2019.