An overview of network structures and node importance in the global aviation system from the year 2011 to 2022
Massimiliano Zanin[1] and Sebastian Wandelt[2] [1]Instituto de Física Interdisciplinar y Sistemas Complejos IFISC (CSIC-UIB), Palma de Mallorca, Spain [2]National Key Laboratory of CNS/ATM, School of Electronic and Information Engineering, Beihang University, 100191 Beijing, China
Abstract: The aviation system is an essential constituent for human mobility in the 21st century. Accordingly, better understanding the underlying - possibly hidden - characteristics is one of the key challenges in air transport research. Network science has developed into a key domain for analyzing complex, inter-connected systems, with many studies having used network science techniques to dissect the universal patterns by the abstraction into a network-like structure. After more than two decades of aviation network analysis - the earliest influential papers date back to the early 2000s, providing a synopsis of the existing techniques and assessing the relevant characteristics on the global aviation system is judicious and helpful for the entire air transport community. In this study, we make three major contributions. First, we review the existing literature on complex network analysis of aviation system, having appeared in the past two decades, identifying key trends in the analysis and their results. Second, we provide a data-driven, network science-based analysis of the global aviation system and two of its variants for period from 2011 to 2022, leading to one of the most comprehensive studies in the literature. At the core of our analysis is the task of identifying node importance and answering the question how well complex network-based methods help to reveal the critical nodes in the system. Third, we derive a set of relevant research directions which we deem instrumental for advancing our understanding of global aviation and its subsystems through the lens of network science. We believe that our study provides a unique combination of biographical synopsis and data-driven analysis for the evolution of our global aviation system.
Keywords:Aviation;Complex networks;Data-driven analysis Citation:Zanin, M. and Wandelt, S. (2023). An overview of network structures and node importance in the global aviation system from the year 2011 to 2022. Journal of the Air Transport Research Society 1(1): 63-80 DOI:https://dx.doi.org/10.59521/5E2DDEC9FAD4593B Download:PDF
1 Introduction
Network science, an actively developed domain for more than two
decades now, provides excellent tools for understanding the structures
and dynamics of real-world systems (Barabasi 2013; M. E.
Newman 2010; Zanin and Lillo 2013). A multitude of complex
network abstractions have been analyzed, among which are social
networks (Scott
2012), power grids (Pagani and Aiello 2013), biological
networks (Bagler and
Sinha 2005), and transportation systems (Wandelt, Sun, and Cao 2015); see
(Boccaletti et
al. 2006) for an introduction. Air transportation is no exception
here, with many studies having used techniques from the network science
domain to identify the complexity and hidden dynamics of air
transportation systems at various scales and spatial/temporal
resolution (Sun,
Wandelt, and Zanin 2017). The most-frequently analyzed air
transportation system abstraction are so-called airport networks, where
nodes represent individual airports and a link exist between a pair of
nodes, if and only if there exists at least one direct flight between
these two airports in a given time interval. A central part of analyzing
air transportation systems as a network addresses its complex
properties (Azzam,
Klingauf, and Zock 2013), such as, scalability (Barabási and Albert
1999), controllability (Jia and Barabási 2013), safety event
patterns (Zanin
2014), resilience (Sun, Gollnick, and Wandelt 2017), and
communities (Palla et al. 2005). Existing
research has mostly focused on the analysis of domestic / regional
airport networks and relatively short periods of time, presumably due to
the limited availability of data. It can be arduous to collect data at a
global scale and for longer periods of time, e.g., multiple years.
Examples for existing spatially / temporally-limited studies include
research on the US airport network (Jia,
Qin, and Shan 2014; Lin and Ban 2014; Neal 2013; Gautreau, Barrat, and
Barthélemy 2009; Bounova 2009), the European airport
networks (Paleari,
Redondi, and Malighetti 2010), some domestic subnetworks of
Europe, such as Portugal (Jimenez, Claro, and Sousa 2012),
Greece (Papatheodorou and Arvanitis
2009), and Italy (Guida and Maria 2007); the Chinese
airport network (Wang, Mo, and Wang 2014;
Y. Zhang 2010), the Indian airport network (Bagler 2008), and the Brazilian
airport network (Luis EC da Rocha 2009). Most
studies in the literature analyze a single snapshot, e.g., using data
for a single week or month. Cross-comparison of the results are often
difficult, given the use of various data sources, discrepancies in data
preparation, and differences in presentation / interpretation. This
leads to situations in which results on aviation network analysis become
seemingly contradicting, e.g., highlighted by (Azzam, Klingauf, and Zock 2013; Neal
2014). Here, it should be particularly noted that airport
networks are not static, but evolve over time. This fact is often
neglected by the research community and snapshots of networks at
different points of time have often been analyzed. As discussed by (Barabâsi et al.
2002), most quantities used to characterize a network are time
dependent and their values at a given time point alone could tell little
about the whole network.
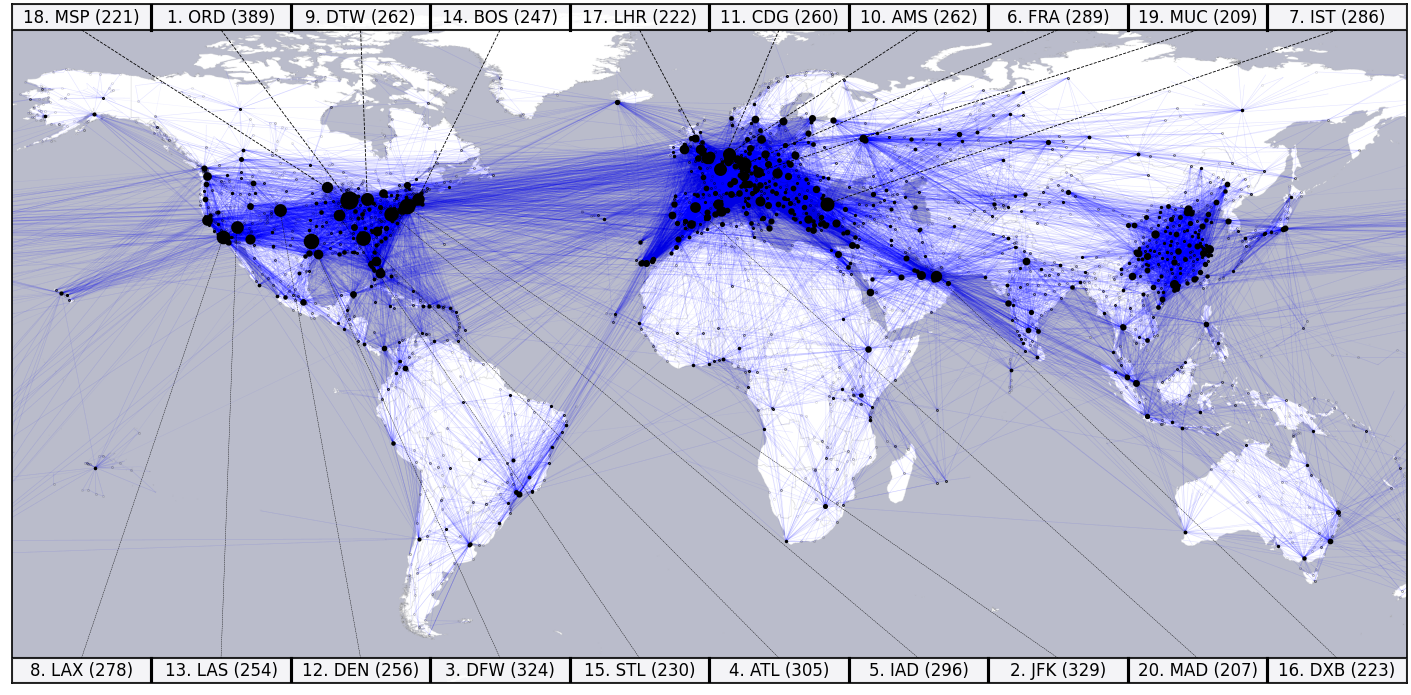
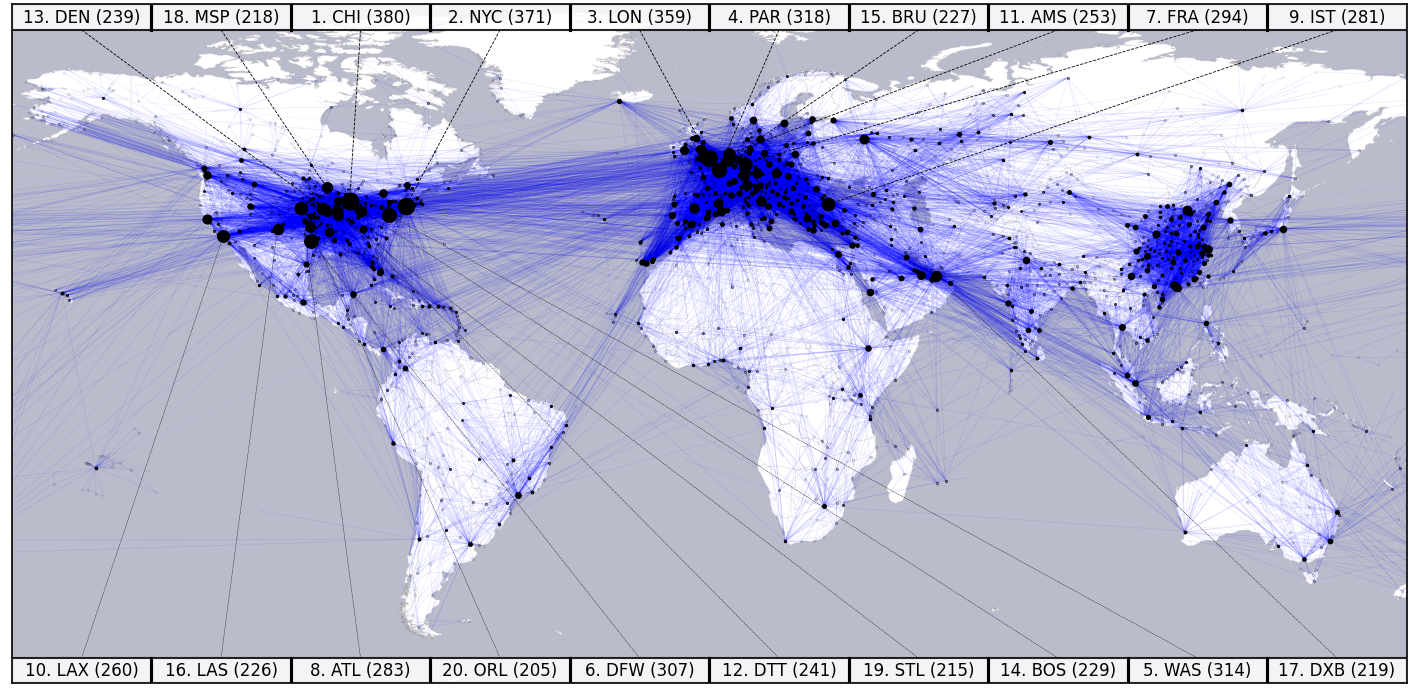
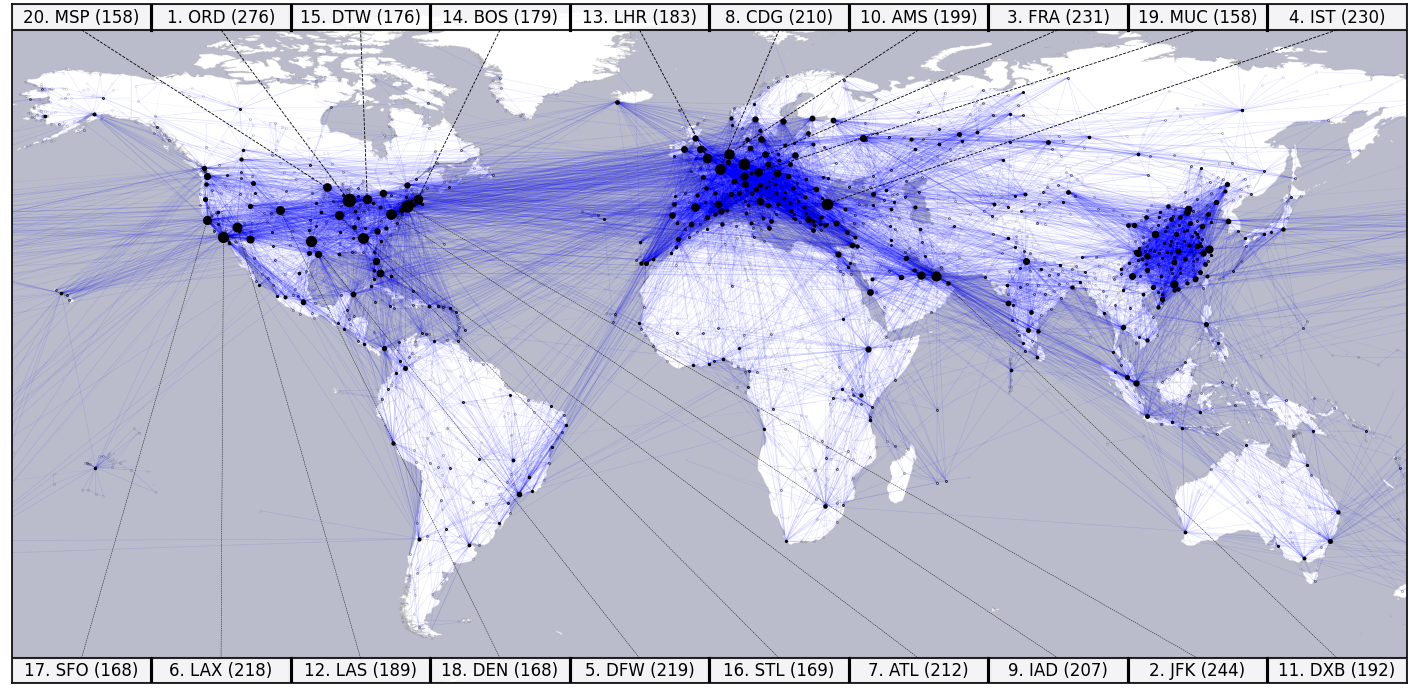
Figure 1: The global airport network based on data for April
- June 2022. Top 20 nodes with the highest number of connections are
highlighted by their IATA code.
In this study, we review the analysis of the global airport system
through the usage of network science methodologies. Based on quarterly
data for the years 2011 to 2022, we compute a set of widely used network
characteristics / node centralities and report their evolution
throughout the period under investigation. Figure 1 shows a visualization
of the worldwide airport network for the second quarter (April - June)
in the year 2022, i.e., during the so-far peak of the recovery from the
COVID-19 pandemic. Here, nodes represent airports and a link exists
between two nodes if there exists at least one direct flight between the
two airports. The nodes are represented by circular markers whose size
corresponds to the number of destinations which can be reached by a
direct flight. The top 20 airports according to the number of directly
reachable destinations are highlighted with their IATA code. We can
clearly identify the three major powerhouses of aviation: North America,
Europe, and China. In addition to investigating the airport network, we
also cover two interesting contractions: city-networks and networks
induced by multiple-airport regions. The nodes in these networks are
aggregated from airports to cities and multiple-airport regions,
respectively. Complex network techniques help to analyze a system, by
identifying hidden, yet universal patterns. In this study, we report
results for 48 quarterly snapshots of the three network layers. All
results are accompanied by a comprehensive discussion of managerial
implications, i.e., we do not only report the numerical results but also
provide recommendations on how to interpret the results and what
aviation stakeholders can take away from such an analysis. Based on our
comprehensive analysis, we provide a set of suggestions for future
research in the air transport domain. We are not aware of any other work
in the literature covering the evolution of the global aviation system
at such a depth and extensive temporal evolution. The most related work
in the literature is (Wandelt, Sun, and Zhang 2019), who
review and compare the evolution of domestic airport networks for
Australia, Brazil, Canada, China, India, Russia, US and Europe during
the period 2002–2013, being the first study performed on a consistent
global dataset and allowing for direct comparisons of network features.
Our analysis is complementary by investigating the recent evolution of
the global airport system instead, notably covering the full COVID-19
pandemic cycle. In addition, our study is complementary to more
review-like works, e.g. (Zanin
and Lillo 2013; Lin and Ban 2013; Luis EC Rocha 2017; Sun and Wandelt
2021), by providing analysis and research guidelines through
experiments on real-world data. We believe that our study contributes to
the aviation community, by providing a comprehensive analysis of the
global aviation system on a consistent dataset for a period of twelve
years, accompanied by a thorough discussion of managerial insights and
policy implications.
The remainder of this study is structured as follows. Section 2 provides a broad overview for studies
on network-based analysis of air transportation subsystems. In addition,
we highlight the relevance of the subject to the Air Transport Research
Society (ATRS)1 by discussing related abstracts from
the Air Transport Research Society World Conference series published in
recent years. Section 3 lays
the formal foundation of our study by introducing the definitions
relevant to airport networks and their aggregations. In addition, we
revisit the definition of various network characteristics and node
centralities, in order to enable a well-defined, informed analysis of
the global aviation system. Section 4
constitutes a major contribution of our study, the analysis of the
system’s development in the past twelve through the lens of complex
networks. We report the evolution of a wide range of indicators, leading
to - what we believe is - the most comprehensive study in the literature
on the subject. Section 5 further
contributes to the air transport research community by deriving a set of
recommendations for future work, which will hopefully help other
researchers do identify novel and relevant subjects for their future
studies.
2 Literature review
In this section, we provide a broad overview on the existing
literature covering network aspects of the aviation system. The domain
of network science has emerged in the turn of the millennium, with
several seminal papers on the analysis of real world systems as complex
networks (Reka
Albert, Jeong, and Barabasi 2000; Callaway et al. 2000; Cohen et al.
2000; Réka Albert and Barabási 2002), see (Barabasi 2013) for an excellent
overview. The aviation system has been an exemplary case study in this
area right from the beginning, given the tremendous importance of
aviation for human mobility. Throughout the past 20 years, complex
network analysis was used to study air transportation systems of various
types, levels, and resolutions; we review the relevant literature on
this subject below. Many previous studies have analyzed the degree
distributions of the worldwide air transportation network and regional
subnetworks, for instance, fitting distributions which obey double
power-laws (Paleari,
Redondi, and Malighetti 2010; Guida and Maria 2007; W. Li and Cai 2004;
W. Li et al. 2006; Chi et al. 2003), truncated power-law (Jia,
Qin, and Shan 2014; Bagler 2008; Xu and Harriss 2008; Han, Qian, and Liu
2007; Guimera et al. 2005), or exponential (Wang et al. 2011; Luis
EC da Rocha 2009). Categorizing distributions into true
power-laws and log-normal is often difficult, especially in presence of
random multiplicative processes (M. E. J. Newman 2005; Clauset,
Shalizi, and Newman 2009). This problem is discussed by Azzam, Klingauf, and Zock
(2013) in the context of worldwide air transportation network,
observing a non-stationary behavior of the distributions.
We discuss region-specific studies, which analyze a subset (often
domestic or continental) of the global aviation system. Many studies
have been conducted on the United States domestic network, mainly due to
the availability of data and the size of the network. (Chi et
al. 2003; Cheung and Gunes 2012; Jia and Jiang 2012) have
revealed small-world characteristics of the network, scale-freeness, and
disassortative mixing properties. The temporal evolution of the United
States airport network at city level from 1990–2010 was analyzed by
Jia, Qin, and Shan
(2014) as well as by Lin and Ban (2014), respectively.
Both showed that the network preserves scale-free, small-world, and
disassortative mixing properties over time. Neal (2013) reviewed the business travel
aviation network in the United States from 1993 to 2011 at node level,
dyadic level, and system level. The system-wide analysis revealed that
business travel among US cities is increasingly symmetric and evenly
dispersed. Various studies have analyzed the complex network properties
of the European aviation system as a complex network (Burghouwt
and Hakfoort 2001; Burghouwt, Hakfoort, and Ritsema van Eck 2003; Sun,
Wandelt, and Linke 2015; Zanin 2015), including its community
structure (Gurtner et
al. 2014) and individual subnetworks, such as Italy (Guida
and Maria 2007; Quartieri et al. 2008a, 2008b), Portugal (Jimenez, Claro, and Sousa
2012), and France (Thompson 2002). The third region of
high interest is the Chinese airport network, see (W. Li and Cai 2004; Wang, Mo,
and Wang 2014). A few studies in the literature perform
comparisons of subnetworks. Paleari, Redondi, and Malighetti (2010)
compared the structure and performance of the airport networks in US,
Europe, and China in order to find out which network is most beneficial
for the passengers. The results showed that the Chinese airport network
provides the quickest travels for passengers; the US airport network is
the most coordinated; while the European airport network provides the
most homogeneous level of service. A dynamic fluctuation model is
proposed by H.-T. Zhang
et al. (2014) and evaluated on the airport networks for China,
Brazil, and Europe. (Wandelt, Sun, and Zhang 2019)
provided a comprehensive comparison of domestic aviation network
evolution for the years 2002 to 2013.
Given the wide application of tools for network science and the
importance of designing resilient air transportation systems, a rich
body of studies has emerged in recent years. It is beyond the scope of
our study to review all existing papers on this subject. Instead, we
report a few seminal papers. For a recent, broad overview on complex
network-based robustness / resilience analysis, please refer to (Wandelt et al.
2018) and (Sun and Wandelt 2021).
Much of the literature on complex network robustness is concerned
with the identification of important nodes. While defining a measure for
computing the optimal ranking of nodes is straightforward (given a clear
concept of dependency of the network on a specific node), these
definitions are usually computationally intractable. Accordingly, many
researchers have proposed different methods for node importance
rankings, usually a) adapted from traditional node centrality using in
network science or b) based on tailor-made, yet scalable definitions. We
review studies which have appeared in the past twelve years below, based
on the recent survey of (Sun and Wandelt 2021).
(Wilkinson, Dunn,
and Ma 2012) investigate the vulnerability of the European
airport network to spatial hazards, arguing that spatially coherent
phenomena are much more damaging than uniformly random ones. (Conti, Cao, and Thomas
2013) investigates disruptions to the airport network of the
United States based on centralities, including PageRank,
Hubs/Authorities, closeness, and betweenness. (H. Kim and Anderson 2013) explore the
robustness of network under dynamic attacker and defender interactions,
with a use case on the United Staes airport network. (Marzuoli, Feron, and Boidot
2014) study the resilience of the United States airport network
under different attack strategies, including degree, distance strength,
and outreach. The authors discuss the inherent vulnerability of the air
transportation system. (Wandelt, Sun, and Cao 2015) propose
a novel node attack computation strategy for air transportation networks
based on Monte-Carlo tree search, which scales up well to
continental-sized airport networks. (Requião da Cunha 2015) design a
so-called module-based attack method, based on topological communities,
which is evaluated on the United States airport network. (Clusella et al.
2016) report on the explosive percolation process, based on a
subset of the global airline network. (Cong et al. 2016) use spectral
clustering to identify the critical airports in the Chinese airport
network, leading to six distinct categories of criticality. (Sun, Gollnick, and Wandelt
2017) examine the resilience of the worldwide airport network
under a wide range of targeted attacks, using difference attacking
strategies and distinct resilience measures. (Clark et al. 2018) compare a set of
node properties on the United States air transportation network and
dissect the nodes’ central roles for robustness and recovery. (Wen, Tu, and Wu
2018) propose a node importance ranking based on so-called
no-return nodes. Results on the Chinese airport network and the United
States airport network are reported. (Wong et al. 2020) use data-driven
methods to analyze the resilience of individual US airline networks; it
is shown that simultaneously considering multiple approaches leads to
more comprehensive understanding of the robustness. (Sun, Wandelt, and Zhang
2020b) identify the critical nodes in the air transportation city
network, where nodes are aggregated from airports to cities, and links
represent flights between cities. (Chen, Wang, and Jin 2020)
investigate the network robustness evolution of the Chinese air
transportation city network from 1975 to 2017. (Qian and Zhang 2022) take into
account weights when analyzing the robustness of the Yangtze River Delta
airport network. (Ersoz, Kilic, and Aldemir 2022)
discusses the opening up of Turkey’s aviation system under the
perspective of resilience against COVID-19 from the perspective of
complex networks.
In order to highlight the importance of complex network analysis to
the Air Transport Research Society, we review related abstracts /
presentations from the ATRS World Conference within the last six years,
in historical order. (Takada 2017) investigates historical
changes of Japanese air transportation network. Various node / network
properties were computed, including clustering coefficient, inter-vertex
distance and the analysis of degree distribution changes in the network.
(Sallan 2017)
develops a cascading failure model for air transportation, which is
evaluated on the Oceanic air transport network for data in the year
2014. The effectiveness of various node attacking strategies is
compared, including node degree, strength, betweenness, and random
selection. (Klophaus
2017) performs a complex network analysis for three major airline
alliances: Star Alliance, Oneworld and Skyteam. The authors clarify
differences between connectivity and vulnerability. Airlines are being
ranked based on the order of importance regarding the network
dismantling problem. It is found that the passengers of an airline are
only loosely related to the importance within the airline alliance
network. (S. Kim
2019) surveys the robustness of the Northeast Asian air transport
network using network science techniques. Properties such as the
characteristic path length and clustering coefficient are reported; and
a spatially-driven analysis of node importance is conducted. (J. Li 2021)
investigates the so-called morphological structure of China’s civil
aviation freight transport network using data for the years 2015 to
2019. The authors try to explore the nexus between the attributes of
network and the influence factor. (Liao 2021) analyzes the evolution of
Chinese low-cost carriers in response to the COVID-19 pandemic, with a
focus on Spring Airlines. Results concerning network connectivity and
topological characteristics are discussed. (Toledo 2021) presents an analysis of
the Brazilian multiplex air transportation network where each layer
corresponds to an individual airline. Results regarding degree
distribution, efficiency, centrality, and node importance are discussed.
(Deng 2021)
investigates the temporal evolution of the Chinese scheduled freighter
networks for the years 2019 to 2021. The authors highlight small-world
and scale-free properties and identify a set of critical nodes in the
network. (Jimenez
2022) analyzes the airline network of China using data for the
years 2009 to 2019. While the authors present the overall structure and
topological characteristics of the network, they propose a multi-layer
realization of the system using three layers (i.e., core layer, bridge
layer, periphery layer) based on k-core values. In addition, the value
and node rankings based on various centrality metrics are reported.
(He 2022)
categorizes market and network characteristics of Chinese international
cargo charter services network in the year 2020 using network science
techniques, among others. It is found that route diversity and density
have quickly recovered from the impact of COVID-19. (Sampaio 2022)
analyzes the resilience of the Brazilian air traffic management system
using complex network theory. The authors report that the network
behaves similarly to a scale-free network, i.e., it is resistant to
random failures, but vulnerable to targeted attacks.
3 Preliminaries
This section provides an overview on the network types in our study
as well as the fundamental complex network characteristics and node
centralities. For an in-depth review of complex networks and their
applications, the readers are referred to (Réka
Albert and Barabási 2002; Boccaletti et al. 2006; Luciano da F. Costa et
al. 2007; Luciano da Fontoura Costa et al. 2011; Barabasi 2013; Cimini
et al. 2019). We start by revising the commonly-used definition
of a complex network and then proceed to discuss three instances related
to air transportation. The data used in this study was obtained from
Sabre Market Intelligence 2.
Definition 1 (Complex network). A complex
network CN consists
of a set of nodes, denoted with nodes(CN)
and a set of unweighted links between nodes, denoted with links(CN).
Each link is represented as a tuple (u,v), where u is the source of the link and
v is the target of the link. A
link (u,v) is called
outgoing for node u
and incoming for node v. The length of a path (a sequence
of nodes [u1,...,un])
is defined as the sum of the weights, in an unweighted network this is
the number of links on the path. A shortest path in a complex network
between two nodes u and v is a sequence of nodes with the
minimum path length. The number of shortest paths between nodes u and v is denoted with σu, v.
Two nodes u and v are connected, if there
exits at least one path from u
to v.
The most frequently used application of complex network to air
transportation is presumably the so-called airport network, given the
rather natural interpretation of nodes and links:
Definition 2 (Airport network). An airport
network APT
is a complex network such that nodes(APT)
is a set of airports and links(APT)
contains all pairs of airports which have at least one direct flight in
a specific period of study.
While the airport network is undeniably of importance, it neglects
one essential element of the aviation system: Airports are not evenly
distributed across the land surface on earth. Instead, they tend to
cluster together around populated areas, maybe with the most notable
exception of the Arctic and polar areas. Generally, there are various
metropolitan regions which are served by multiple airports. For
instance, New York is served by seven airports and London is served by
six airports3. Keeping this in mind, it is very
natural to aggregate all airports serving a city into a single node,
obtaining a city network:
Definition 3 (City network). An airport network
CIT is a
complex network such that nodes(CIT)
is a set of cities and links(CIT)
contains all pairs of cities which have at least one direct flight in a
specific period of study. The presence of a direct flight between two
cities is evaluated based on a predefined mapping of airports to cities.
In our study, the mapping comes directly from Sabre Market
Intelligence.
The third type of network in this study is a combination of airport
networks and city networks, based on the notion of multiple-airport
regions. Airports are the constituting elements for the nodes:
Definition 4 (Multiple-airport region network).
An multiple-airport region network MAR is a complex
network such that nodes(MAR)
is a set of airports (representing specific airport regions) and links(MAR)
contains all pairs of regions which have at least one direct flight in a
specific period of study.
We have constructed the multiple-airport regions following the
methodology of (Sun
et al. 2017), briefly explained below. Using the Open Source
Routing Machine (OSRM) (Luxen and Vetter 2011), the
car driving times between all pairs of airports have been estimated.
Then, we iterate over all airports in our study in the descending order
of passengers (with the year 2019 as reference) and evaluate the driving
distance to all other airports. Once the distance to the larger airport
is below a threshold, we assign that airport as belonging to the MARs of
the larger airport. In addition, we mark the airport as being assigned
and do not try to reassign it in the future. The threshold for temporal
distance is set to 2.5 hours in this study, which means, that if two
airports are reachable within 2.5 hours by ground transportation, they
are potentially merged.
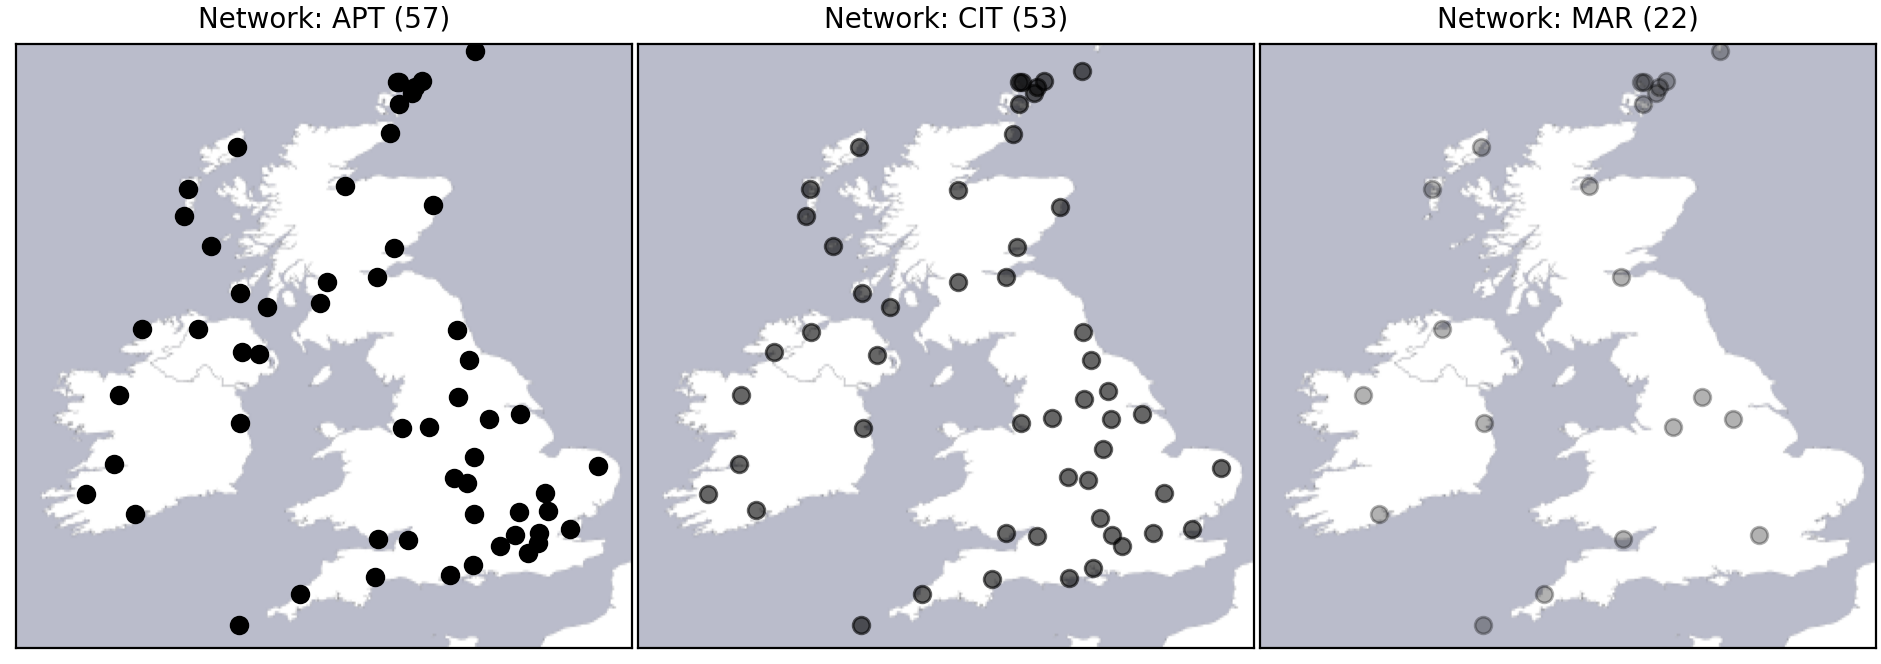
Figure 2 provides an example of
the three different network aggregations based on a small example for
Great Britain and Ireland. Figure 2(left) shows the
locations of 60 regularly served airports for these two countries.
Figure 2(center) shows the
locations of cities after aggregation from airport-level to city-level.
The number of cities is slightly smaller than the number of airports in
this example4. The reduction in our example is
mainly due to the number of airports serving the Greater London region.
In the city network aggregation, these airports are all represented by a
single node. Figure 2(right) further
aggregates the network by multiple-airport regions. It can be seen that
the number of nodes is reduced significantly, compared to the two other
aggregation levels, 22 airports (in MAR) versus 57 airports (in APT) and
53 cities (in CIT). The reason is that now airports are merged based on
their ground accessibility, irrespective of the cities they are
associated with. Two properties of the MAR aggregation should be noted.
First, the airports are rather regularly distributed for most part of
the two countries which is due to the contraction based on driving
times. Second, the airports on islands are not aggregated. The rationale
is that the islands have no driving connection and, accordingly, do not
have a convenient ground alternative. While one could argue that these
islands could be connected by ferry or similar services, we do not have
global data for ferry connections, let alone their frequency.
Figure 2: Aggregation example for Great Britain and Ireland
(only nodes are shown).
A common problem in complex network analysis is the identification of
node importance. Naturally, the definition of how important a node is in
the network, depends on the dynamics one wants to consider. Table 1 revisits the definition of
three frequently used node centralities. While the degree and clustering
coefficient are local node centralities, since they only consider the
neighborhood of a node when computing the centrality value, betweenness
centrality requires global knowledge about the network. We briefly
interpret the three metrics in context of aviation as follows. The
degree of a node counts the number of nodes which can be reached by a
direct flight; in case of the CIT / MAR network, this includes
additional ground-based transportation at the origin or destination.
Sometimes normalized values are reported instead, where the degree is
divided by the total number of nodes. The betweenness centrality of a
node indicates how frequently this node lies on shortest paths in a
network. This centrality is maybe the most mis-interpreted centrality in
aviation research: The computation of this value assumes that there
exist uniform demands between all pairs of nodes in the network; an
assumption which is clearly invalid in reality. The demand across
airports (and cities) is highly skewed and depends on population size,
distance, economic indicators, and various other properties.
Accordingly, one needs to be very careful, when taking the betweenness
of a node as representative for its importance in the aviation system,
while taking into account the true managerial implications. We will
report on the extent of this effect in our analysis below (Section 4). The clustering coefficient - from
a managerial perspective - asks how much connectivity does an airport /
city provide to its connected airports, i.e., whether it is likely that
these neighbored nodes are well-connected by themselves or not.
Table 1: Commonly-used node centrality measures for the analysis of air
transportation systems
Metrics
Equation
Interpretation
Degree (centrality)
ki = ∑jaij
where aij is
the connection between node i
and node j: aij = 1
if there is a connection existing; aij = 0
otherwise. This metric refers to the number of connections with other
nodes in the network.
Betweenness centrality
Bwi=ås ¹ t (sst(i))/(sst)
where σst is
the number of shortest paths going from node s to node t; σst(i)
is the number of shortest paths going from node s to node t and passing through node i. This metric is proposed by
Freeman (Freeman
1978) and it indicates the number of shortest paths going through
a node.
Clustering coefficient
Ci = (åj,kaijaikajk)/(ki(ki-1))
where aik is
the connection between node i
and node k, ajk is
the connection between node j
and node k. This metric gives
an overall indication of how nodes are embedded in their
neighborhood.
In addition to the node centralities introduced above, we review a
set of network characteristics below. One interesting measure for
complex networks is the so-called all-pairs shortest path average
length. In an airport network, this indicator represents how many hops a
passenger needs to make on average to travel from an origin to a
destination, assuming a uniform demand across all node pairs in the
network. If the network was fully connected, i.e., there is a flight
between every airport pair, then the all-pairs shortest path average
length would be one. Such a solution, however, is infeasible from a
practical point of view, given the limited number of aircraft and the
airlines’ desire to be profitable. Accordingly, with a decreasing extent
of being fully-connected, the average length increases. A related
measure is the global efficiency of a network. The definition of network
efficiency is based on the rationale that the efficiency is inversely
proportional to the distance of node pairs in the network. The average
efficiency is then defined as E=(1)/(N*(N-1))*åi ¹ j Î nodes(1)/(di,j), where N is the number of nodes and di, j
is the distance between Node i
and Node j.
4 Analysis
This section reports our experimental results on the three network
instances (APT, CIT, and MAR) over the period of twelve years.
Section 4.1 investigates the evolution
of network-level characteristics, including the number of nodes, the
number of links, diameter, the global efficiency and the community
structure of the network. Section 4.2
sheds light on the importance of individual nodes and their centrality
values, by reporting on the evolution of degree, betweenness, and
clustering coefficient.
4.1 Evolution of network
characteristics
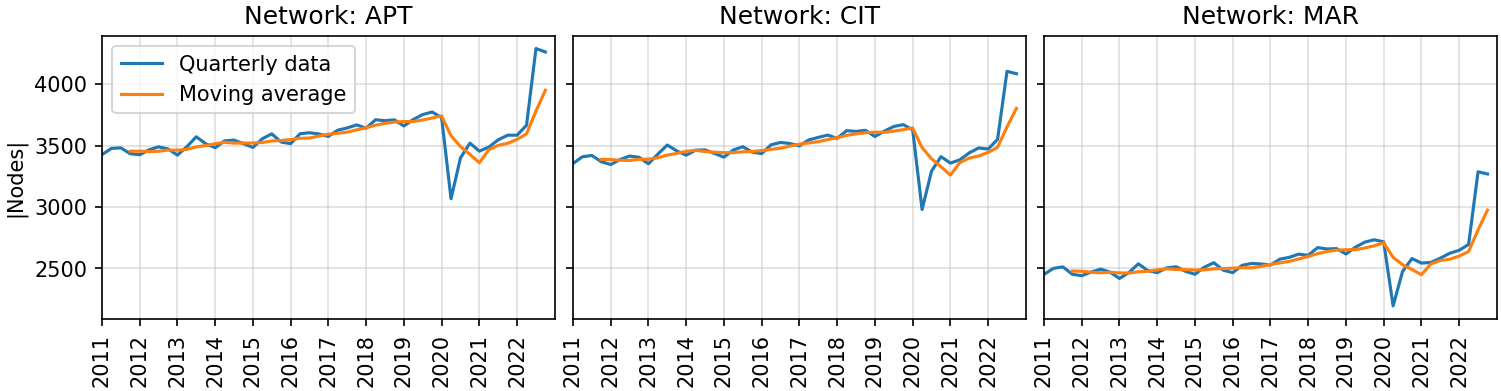
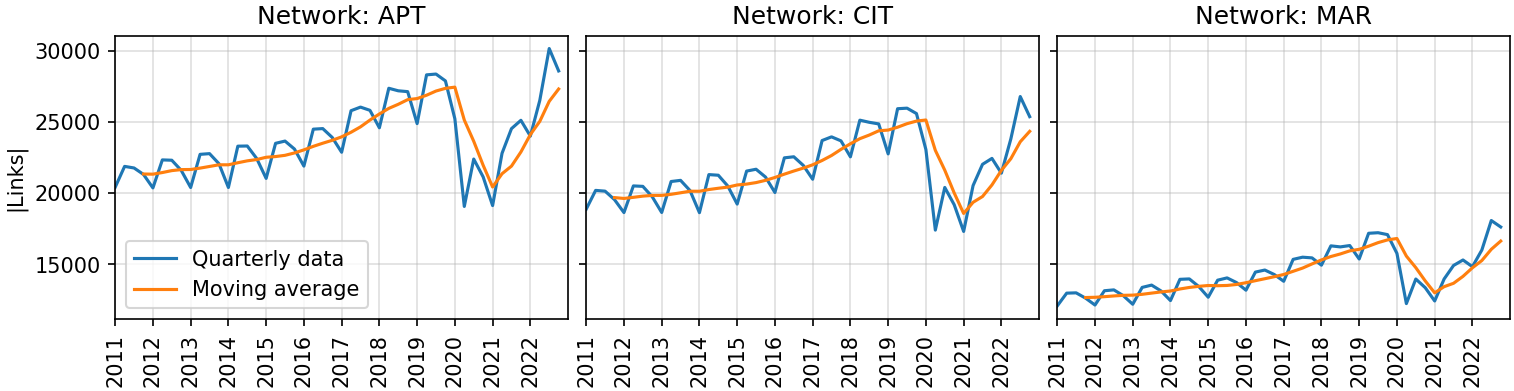
The most fundamental aspects of a network are the number of its core
entities: the number of nodes and the number of links. Figure 3 and Figure 4 reports the evolution of both
indicators for the three network instances (APT: left, CIT: center, and
MAR: right), respectively. The number of nodes and the number of links
is continuously increasing from the year 2011 until the onset of the
COVID-19 pandemic early in the year 2020. The increase in the number of
nodes can be explained by a set of potential factors: the operation of
new airports, increasing traffic which leads to exceeding the cut-off
threshold for constructing the networks, as well as an increased
coverage of Sabre Market Intelligence. Particularly the latter is hard
to quantify from our side. Given the rather strong seasonality of these
time series, we conjecture that the two former factors are much more
significant in contribution than the latter. In fact, it is noteworthy
how the growth and seasonality is clearly visible in all three network
types. COVID-19 had a severe impact on all networks and both indicators,
an effect which we will not discuss in detail here, since it has been
covered extensively in the existing literature, see, e.g. (Sun, Wandelt, and Zhang
2020a). The most notable insight from the two figures is the year
2022, in which we can observe a recovery which not only outperforms
pre-pandemic values but even closely reaches the pre-pandemic trends
obtained by visually extrapolation of quarterly data from the year 2011
to 2019. This observation is striking, and it highlights that the
aviation industry is back on the growth track. The moving average lags
behind so far and the future will show whether this recovery is
permanent or was more of a no-travel-restrictions release event in Q2/Q3
2022. Naturally, this recovery observation based on the number of nodes
and links does not mean that the recovered aviation system is identical
to the pre-pandemic one. Our analysis below will shed further light on
the observable differences.
Figure 3: Evolution of the number of nodes in the global
aviation system at the three different layers. Figure 4: Evolution of the number of links in the global
aviation system at the three different layers.
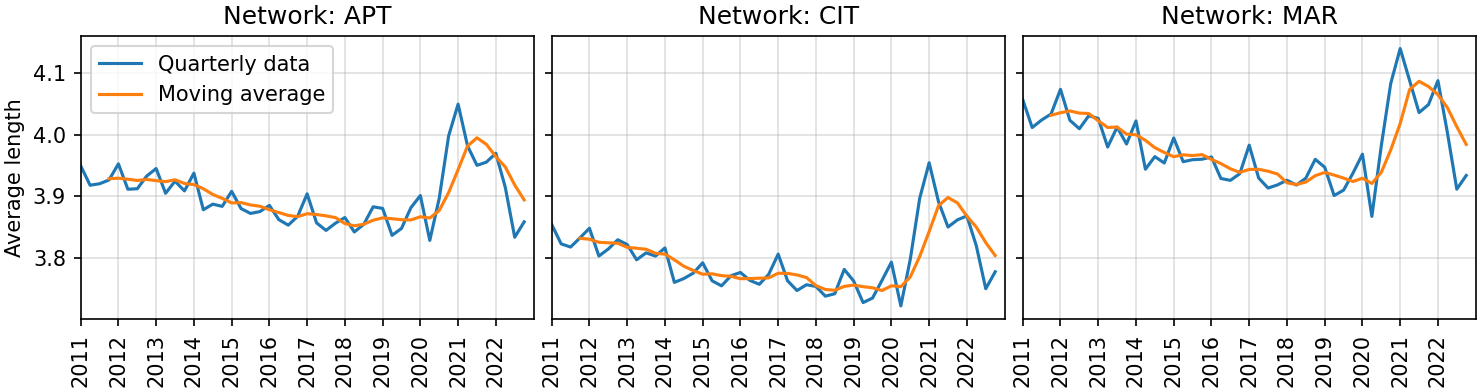
Figure 5 reports the evolution of the average
path length on the three network types. The average number of hops is
around 3.9 – 4.0. Before the onset of the COVID-19 pandemic, we can
observe a slightly decreasing trend in the length, from 3.95 to 3.85
(for airports). During the pandemic, this indicator increased
significantly, but has returned to near pre-pandemic levels in the year
2022.
Figure 5: Evolution of the average all-pair shortest path
length in the global aviation system at the three different layers.
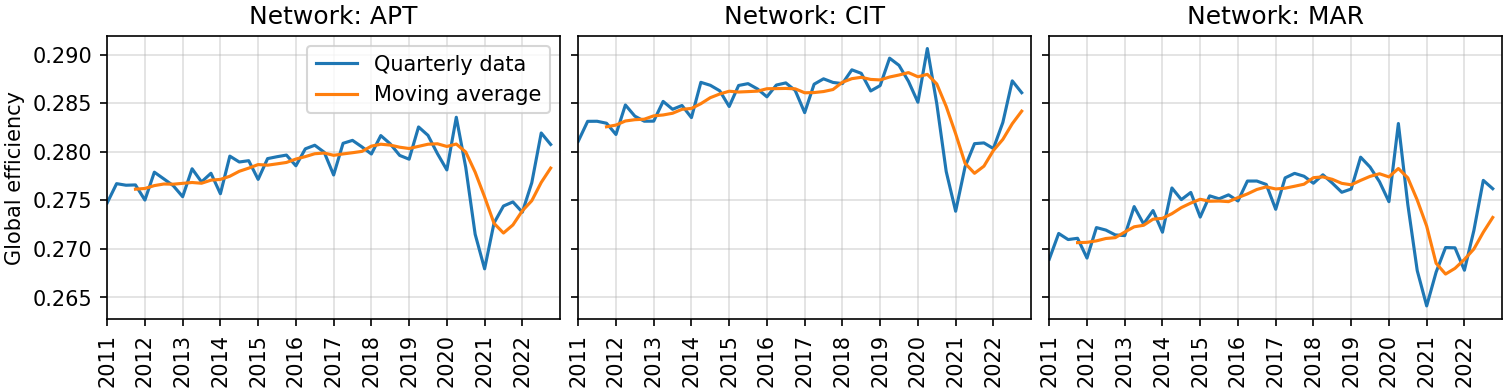
The next complex network indicator in our analysis is global
efficiency (Latora and Marchiori 2001).
Intuitively, the definition of efficiency can be best understood in
terms of communication systems: The underlying assumption is that
efficiency is inversely proportional to distance. In terms of a network,
the communication between nodes with a longer distance, is less
efficient. In terms of aviation, one could describe such an inefficiency
maybe best as inconvenience to the passenger, requiring more hops for
reaching the destination. The global efficiency of a network is the sum
over all reciprocal node pair distance divided by the maximum number of
possible links for normalization. Figure 6 reports the evolution of
global efficiency for the years 2011 – 2022. The overall magnitude of
the indicator is rather stable over time ranging between 0.265 and 0.29
for all three network layers. There is a slightly increasing trend
pre-pandemic. The impact of COVID-19 is apparent. In general, the global
efficiency is believed to be more reliable than path-based
measures (Bullmore and Sporns 2009).
Accordingly, this indicates that the aviation community needs to work
towards ensuring a fully-efficient recovery of the aviation system
post-pandemic.
Figure 6: Evolution of the global efficiency in the global
aviation system at the three different layers.
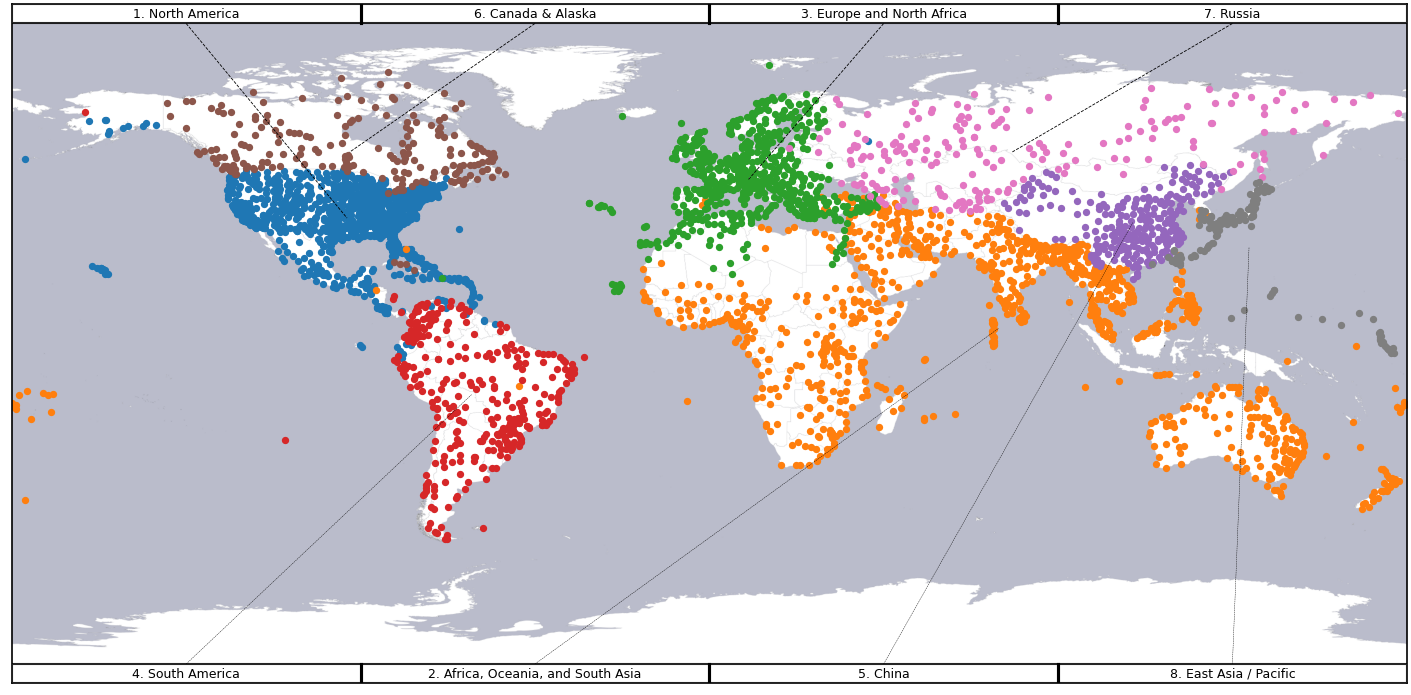
We analyze the community structure of the global airport network for
the third quarter of the year 2022 in Figure 7. The communities
were computed based on the Louvain method for community detection (Blondel et al.
2008). Intuitively, the method aims to optimize the density of
links inside communities compared to links between communities,
iteratively defining new community assignments until no further
refinements are possible or a predefined minimum improvement step is not
achieved. In total, we obtain eight larger communities for the airport
network. The largest community - in terms of the number of nodes - is
constituted by airports in North America (except from Canada and parts
of Alaska). This shows that the United States are much better integrated
with their Southern neighbors (e.g., Mexico, Bahamas, and various
Caribbean holiday destinations), compared to their Northern neighbor
Canada. The second largest community surprisingly consists of Africa,
Oceania, and South-Asia (notably without China). The next communities
are covering Europe, South America, and China, respectively. The case of
China is very interesting, as China was well integrated into its
neighborhood before the onset of the COVID-19 pandemic, but isolated
itself for a period of almost three years. This isolation presumably had
an impact on the entire South-East Asian aviation market. It will be
interesting to see the future development in this area, given that China
has just released all aviation policy restrictions in early 2023.
Figure 7: Communities in the global airport network.
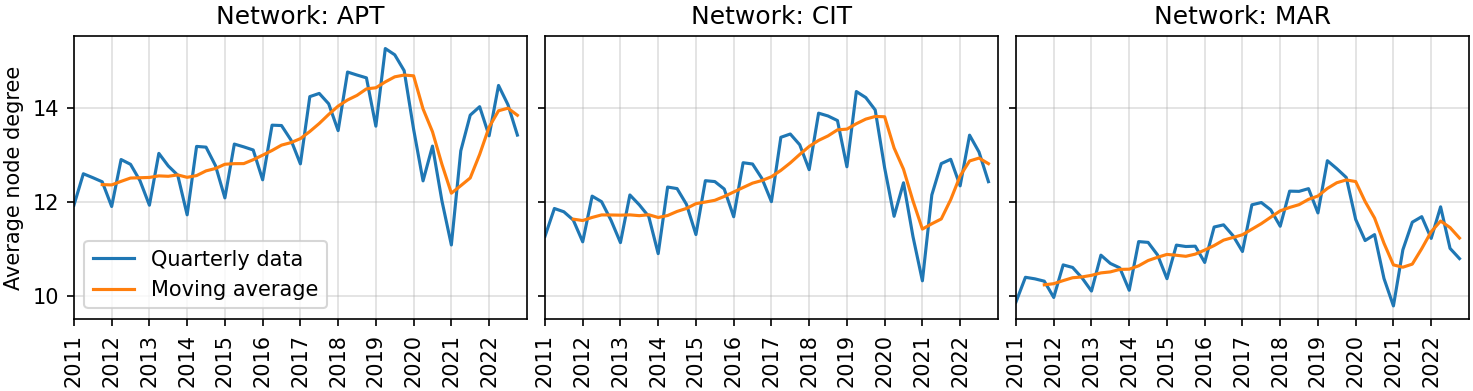
4.2 Evolution of nodal
centralities
In the following part of our evaluation, we will investigate the
evolution of three node centralities. We begin with the degree, which
measures the number (or fraction in case of centrality) of destinations
which are reachable by a direct flight. Figure 8 reports
the evolution of the average degree, aggregated over all nodes in the
network. The average degree varies between 9.5 and 15 for all three
network layers. Between the years 2011 and 2019, this value increased by
roughly 2.5, which means that airports (or cities) were increasingly
connected to two or three more other entities at the end of the period.
During the recovery from COVID-19, in the year 2022, we are back to
2017/2018 levels concerning all three network instances. The degree in
MAR is slight lower (two nodes) than in APT / CIT networks, but the
overall evolution trend is highly similar.
Figure 8: Evolution of the average degree in the global
aviation system at the three different layers.
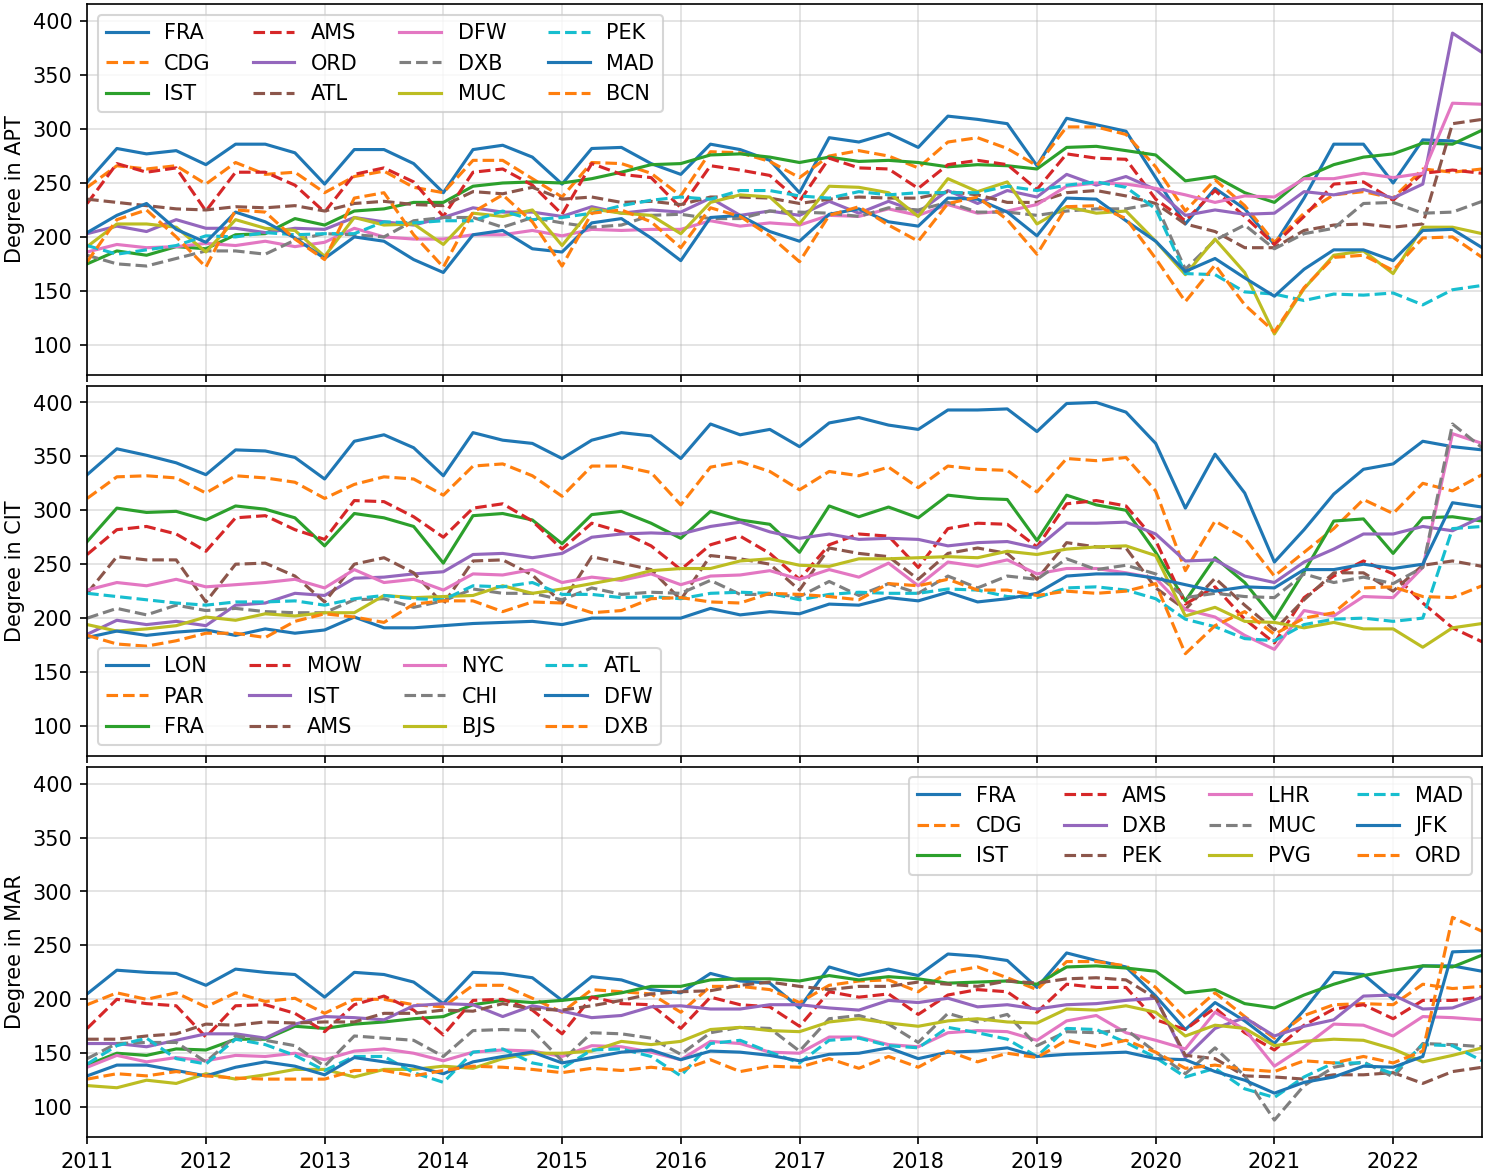
Figure 9 visualizes the
evolution of the top degree nodes in the aviation system. For each
network, we have selected the top 12 nodes with the highest average
degree over the entire period in our study. These nodes are reported
with their IATA codes (for airports) and city codes (for cities). Before
the onset of the COVID-19 pandemic, the ranking of top nodes was
considerably stable, FRA being the highest ranked airport (in APT and
MAR) and LON (London) being the highest ranked city. During the pandemic
and also in the recovery, the rankings of nodes are largely shuffled,
indicating a structurally changed aviation system, where the important
roles have undergone unprecedented changes.
Figure 9: Evolution of top 12 degree nodes.
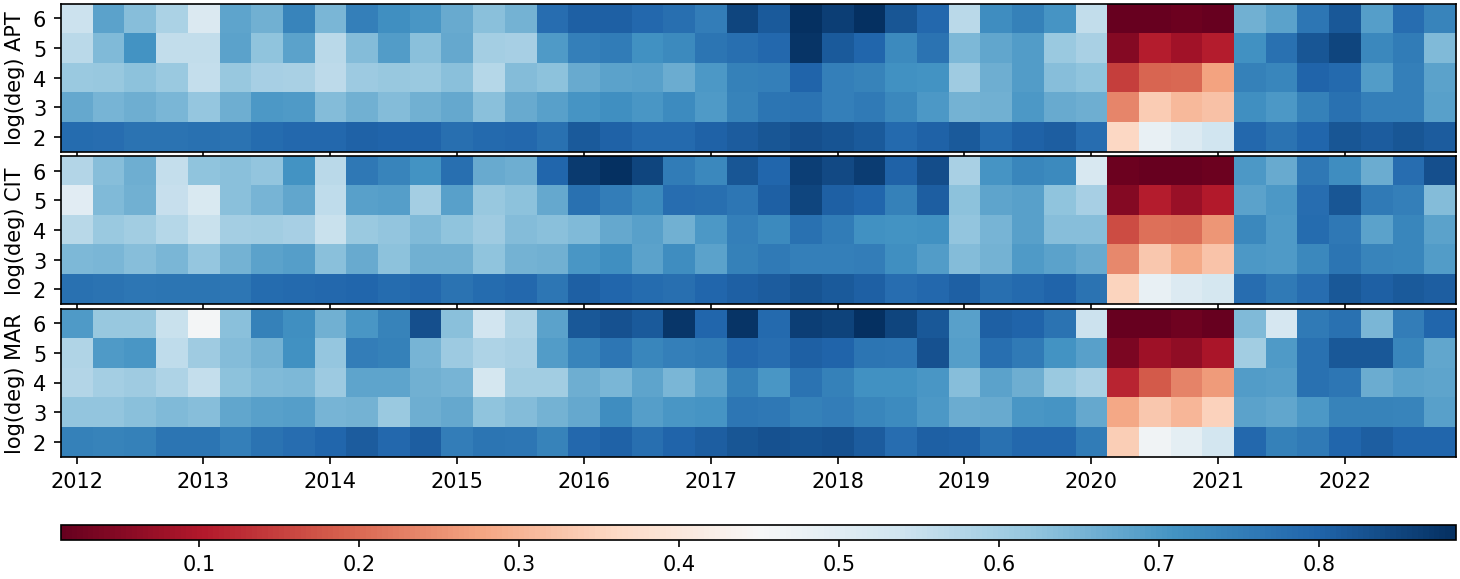
Given the trend of growing average degrees in the system, Figure 10 further investigates which
nodes are growing most. We have computed the changes in degree for each
quarter with respect to the previous year’s quarter and color coded the
fraction of airports which have grown in degree (from red indicating 0%
to blue indicating 100%). We have grouped airports along the y-axis
according the log of degree in the year. The airports with the lowest
degrees (bottom row in Figure 10)
are most coherently growing, indicating by the blue color. The higher
the degree an airport (moving up along the y-axis), the fewer airports
have increased their degrees further, with a notable exception around
the years 2017 and 2018: In both years we find that almost all airports
with the highest degree have succeeded in increasing the degree.
Furthermore, we can see the obvious impact of the COVID-19 pandemic, in
which all airports have lost their connectivity (indicated by the red
color). The extent of degree reductions coherence inside a class
correlated with the airport size. This indicates that some smaller
airports indeed went better through the pandemic, by maintaining their
degrees between 2020 and 2021, i.e, during the peak pandemic impact on
aviation. The listed observations are consistent for all three network
layers under investigation.
Figure 10: Changes of degree in the global aviation system.
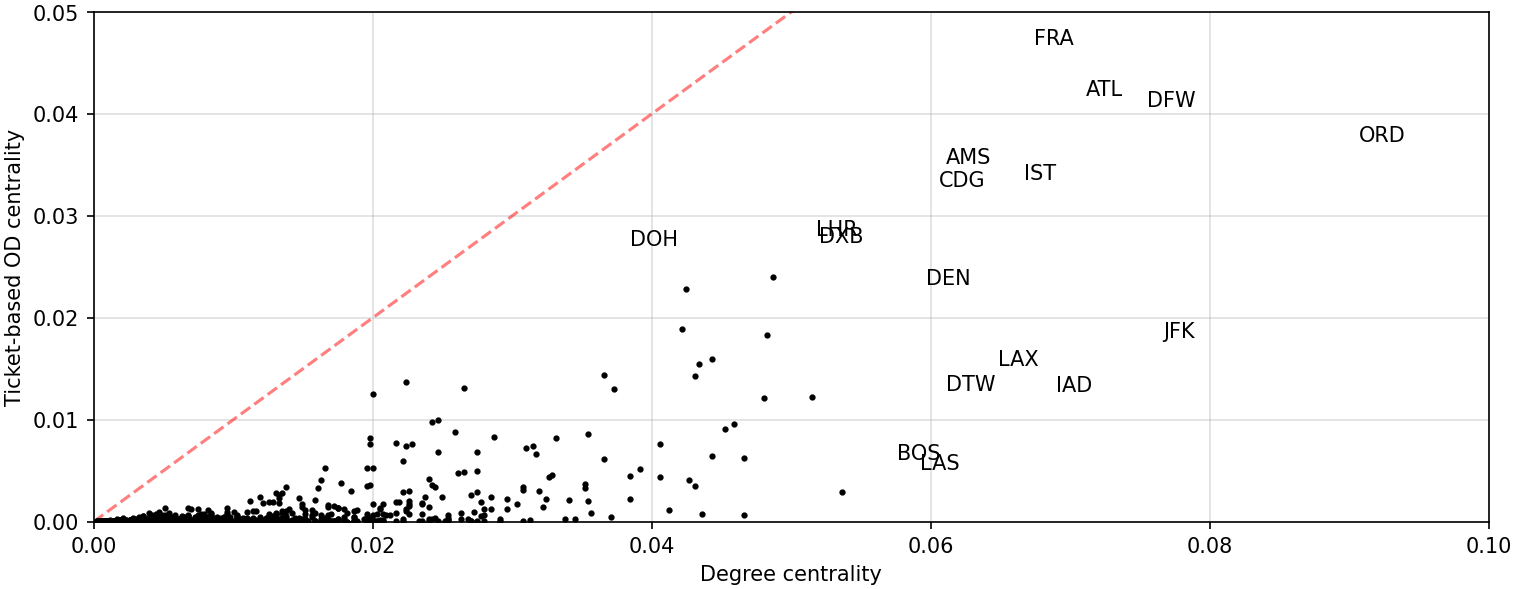
Figure 11 performs a comparison of node
degree against a more realistic measure of node importance: the
ticket-based OD centrality, for data of Q3 2022 in the global airport
network. This centrality measures the fraction of tickets a node appears
in as an intermediate stopover. More specifically, we have iterated all
passenger tickets available from Sabre Market Intelligence which
involved more than one hop and then counted how often each airport (or
city) appeared on the ticket. This number is normalized by dividing
through the total number of tickets. We visualize the result as a
scatter plot where degree is shown along the x-axis and OD centrality on
the y-axis. If both metrics were perfectly correlated, then all markers
would be located along the dashed diagonal. We find that there exists a
positive correlation between both indicators (the Pearson correlation
coefficient is 0.71 at a p-value of 0.0). Nevertheless, there exist
airports with high OD centrality and low degree centrality (e.g., Hamad
International Airport, DOH) and vice versa (e.g., Boston Logan
International Airport, BOS and Harry Reid International Airport, LAS).
The latter airports do provide an efficient service for their local
population, by providing connections to many destinations, but do not
play a significant role as a hub - presumably due to their location
inside the United States and post-COVID-19 ramifications. This
highlights that using the degree for measuring the extent of being a
(true) hub in the aviation system should be done with care, as the
potential connectivity does not necessarily imply that a node is indeed
used as a hub.
Figure 11: Comparison of degree centrality and ticket-based
OD centrality for Q3 2022 in APT.
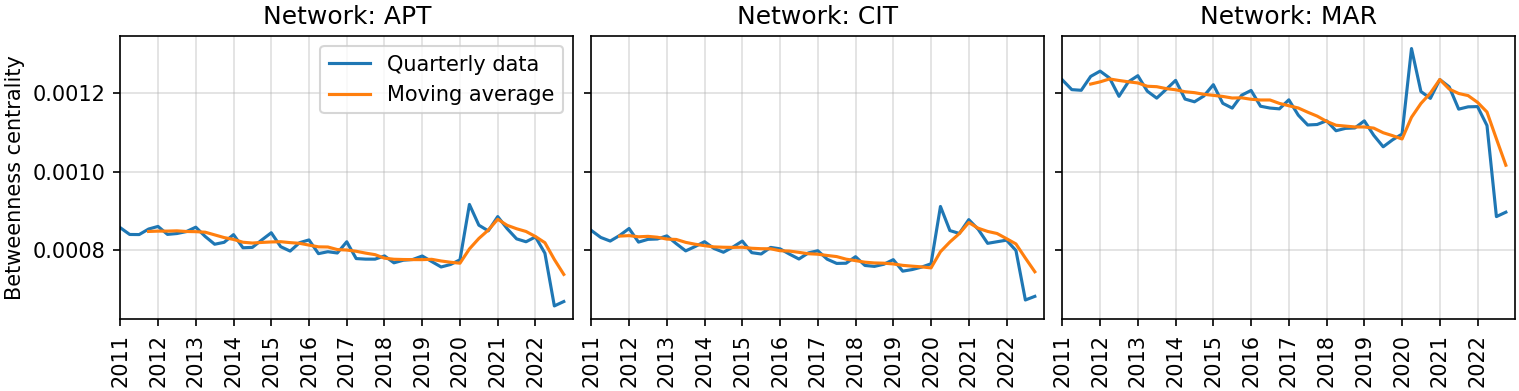
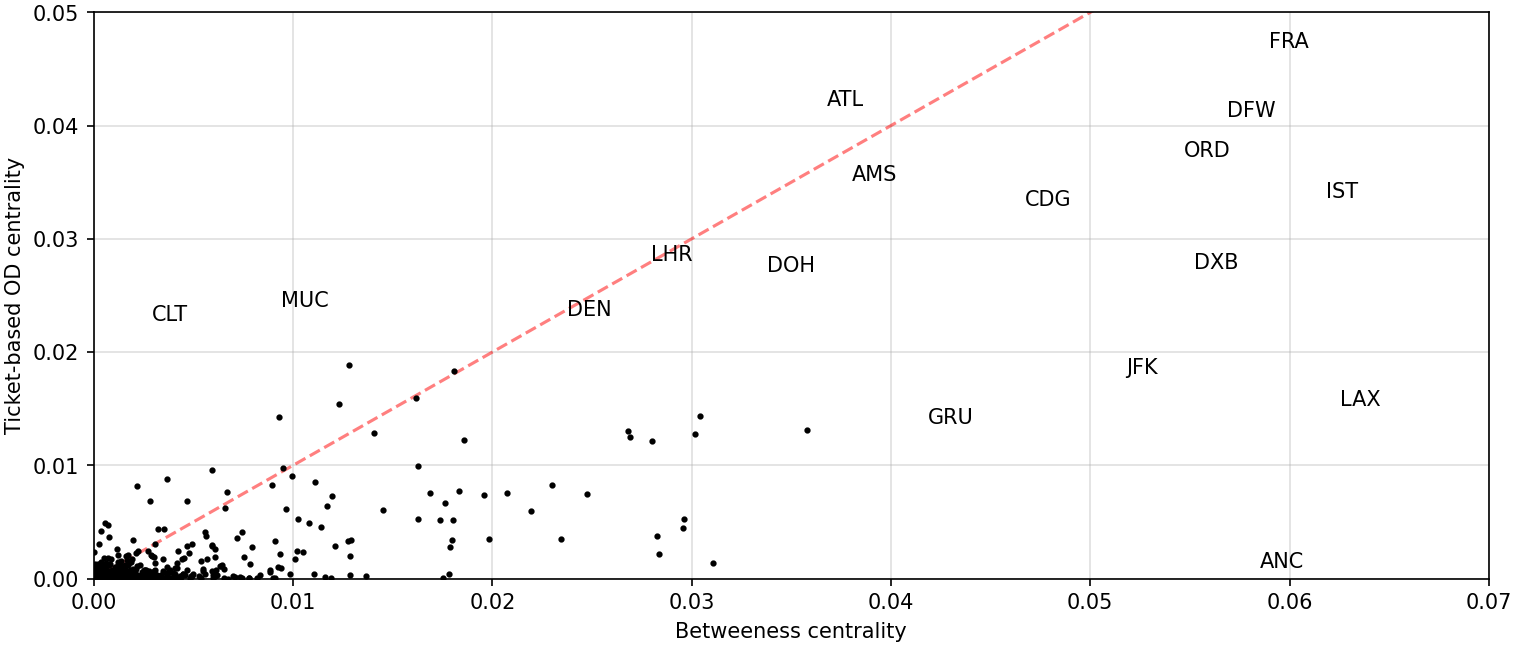
In the next experiments, we investigate the betweenness of nodes.
Figure 12 visualizes the evolution of
system-average betweenness centrality values. Overall, we can observe a
slightly decreasing trend of the metric pre-COVID-19, which indicates
that the role of individual roles as network hubs is slightly
decreasing. The betweenness saw a spike during the COVID-19 pandemic.
Yet, during the year 2022, the value has essentially returned to its
pre-pandemic trend. Figure 13
compares the values of betweenness centrality against ticket-based OD
centrality for Q3 2022 in the global airport network. The extent of
correlation with betweenness is larger than degree (the Pearson
correlation coefficient is 0.80 at a p-value of 0.0). We can, again,
airports with high OD centrality and low betweenness centrality (e.g.,
Charlotte Douglas International Airport, CLT and Munich International
Airport, MUC) and vice versa (e.g., Ted Stevens Anchorage International
Airport, ANC and Los Angeles International Airport, LAX). Especially the
case of Ted Stevens Anchorage International Airport has become infamous
in the network science literature, as an outstanding example for an
airport with a large mismatch between degree and betweenness, given its
central role in accessing other airports in and around Alaska.
Figure 12: Evolution of the average betweenness centrality
in the global aviation system. Figure 13: Comparison of betweenness centrality and
ticket-based OD centrality for Q3 2022 in APT.
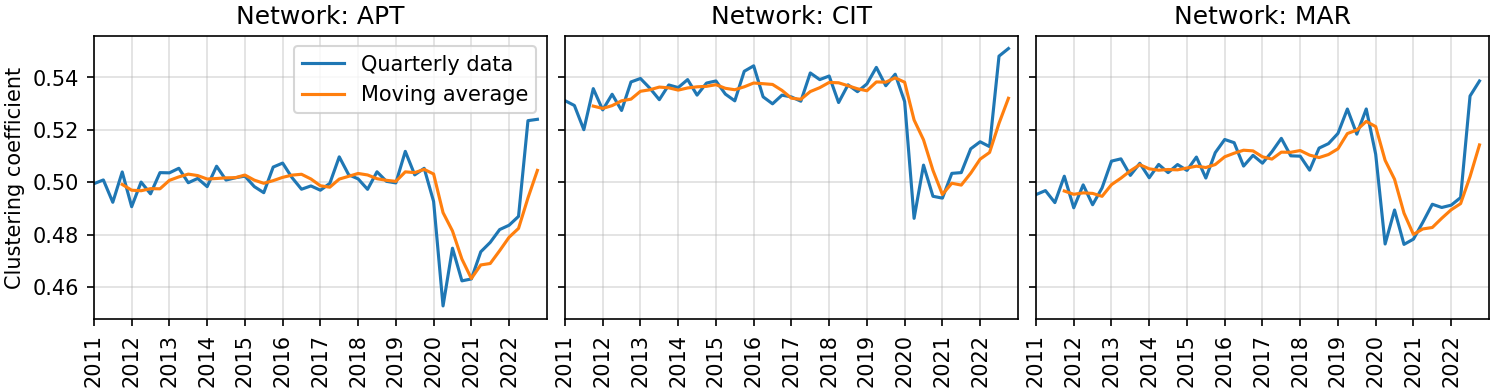
Next, we investigate the clustering coefficient of nodes. Figure 14 visualizes the
evolution of system-average clustering coefficient values. For APT and
CIT, this metric is rather stable, only interrupted by the impact of the
COVID-19 pandemic in 2020 and 2021. For MAR, however, we can observe and
increasing trend from 0.5 to 0.52. This increase shows that at the MAR
level, the neighbors of nodes get increasingly connected, which
indicates a potential reduction in hubbing effects in the global
aviation system. This trend seems to be manifested even during the
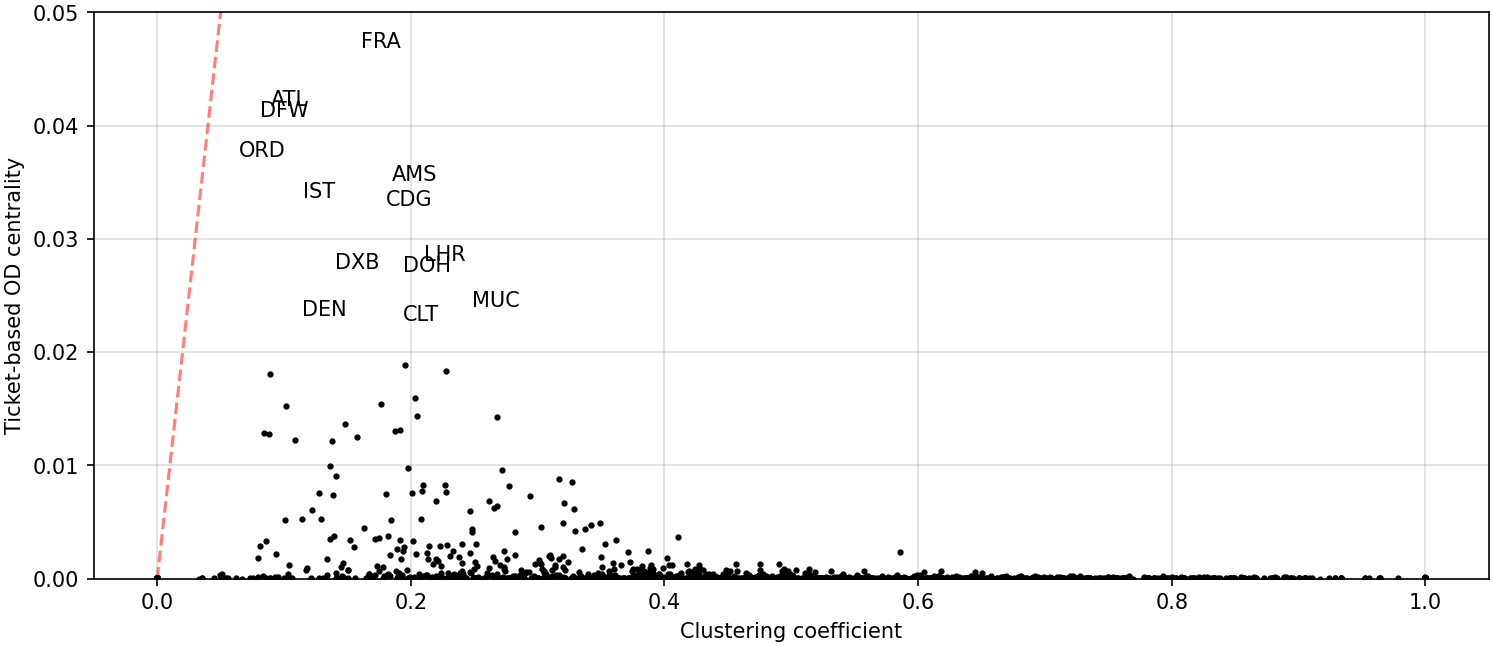
recovery process. Figure 15
complements our analysis by reporting the scatter plot between OD
centrality and clustering coefficient. Contrary to degree and
betweenness, we can observe that the OD critical nodes have lower values
of clustering coefficient. This observation is intuitive, given that
hubs should connect preferably disconnected nodes. The correlation
between the two measures is relatively weak (the Pearson correlation
coefficient is -0.21 at a p-value of 0.0). The presence of some nodes
with high OD centrality and large clustering coefficient are
interesting, managerial wise. For instance, the position of Munich
International Airport (MUC) can be explained by the prominent role of
Lufthansa at this airport. Accordingly, a significant number of tickets
have MUC as an intermediate stop, while other airlines might actually
connect their origin and destination by direct flights. Accordingly, we
believe that the clustering coefficient deserves more attention by
researchers in the future.
Figure 14: Evolution of the clustering coefficient in the
global aviation system. Figure 15: Comparison of clustering coefficient and
ticket-based OD centrality for Q3 2022 in APT.
5 Discussion
We review the major findings of our study in this section and provide
a set of recommendations for future work. These major findings and their
recommendations are discussed in individual subsections,
respectively.
5.1 Explaining the mismatch between
global city and MAR network
In our analysis we have found that the CIT and MAR network reveal
distinct characteristics. MAR had a lower average degree and a higher
average betweenness compared to CIT. In addition, we found the MAR
network to be relatively less efficient than the CIT network. While some
of these results could change depending on the availability of data at
city level and the resolution, the difference is striking, given that
both of these networks aim to measure the same phenomenon: How do groups
of airports interact in the global aviation system? Accordingly, we
believe that there is room for future work on this subject, especially
concerning the development of a realistic and representative measure for
aggregation. Many studies in the literature still use hard-coded
line-by-sight distance threshold, despite the availability of more
realistic criteria such as the ground-based driving distance, applied in
this study.
5.2 A more realistic node
importance measure
We have used a ticket-based OD centrality measure as reference for
node importance in our study. Our findings show that neither of the
complex network measures adequately represent the node importance. While
betweenness centrality reaches a rather high extent of correlation,
there are significant differences especially for nodes with high
betweenness values. Accordingly, betweenness centrality could be used to
filter out unimportant nodes, but not for obtaining a clear ranking of
the top nodes. This fact should be considered carefully in future
studies. Especially when constructing econometric models, degree and
betweenness of a network are often used as proxies for importance. There
is a need for research which develops better estimation techniques and
takes into account universal patterns present in the global aviation
system. In this light, we would like to explicitly mention the need for
models which considers actual aircraft operations for the identification
of true node importance.
5.3 Other network types
While we have analyzed three network types which are most prevalent
in aviation research, there are other networks which could be further
investigated using network science techniques. Particularly, we see two
major areas here. First, we believe that the analysis of time-space
networks - as they are inherent to aircraft as assignment and routing
algorithms, could lead to interesting results, not only regarding
empirical analysis but also as a potential driver for guiding
optimization algorithms / heuristics. Second, there is a need for better
understanding multi-modal interactions, most importantly with respect to
high-speed railway. The analysis of multi-modal networks, especially at
larger scale, could lead to the identification of universal insights and
improvements of our transportation system.
5.4 Reproducible data / network
models for aviation research
We presume that few studies in the literature analyze the global
aviation system due to the limited availability of the data. While some
of the data can be obtained commercially, like we did from Sabre Market
Intelligence, such acquisitions come with significant costs and also
non-disclosure agreements. Accordingly, we would like to motivate the
research community to develop better models for generating
system-representations alike to our global aviation system. The
fundamental gravity model of trade - still used in studies to date - is
nearly 70 years old (Isard 1954). Given the emergence
of data science and increasing availability of big data, it should be
possible to derive methodologically-novel models which describe the
complex patterns in aviation to a better extent than simple gravity
models do. Here, we would like to highlight particularly the promising
usage of grid-based datasets covering, e.g., population density, census
information, and possibly transportation-related data. Using such
grid-based data will likely lead to novel insights beyond the
traditional view of cities as atomic spatial entities.
Acknowledgement
This study is supported by the National Natural Science Foundation of
China (Grant No. U2233214 and Grant No. 62250710166).
References
Albert, Réka, and Albert-László Barabási. 2002. “Statistical
Mechanics of Complex Networks.”Reviews of Modern
Physics 74 (1): 47.
Albert, Reka, Hawoong Jeong, and Albert-Laszlo Barabasi. 2000.
“Error and Attack Tolerance of Complex Networks.”Nature 406: 378–82.
Azzam, Mark, Uwe Klingauf, and Alexander Zock. 2013. “The
Accelerated Growth of the Worldwide Air Transportation Network.”The European Physical Journal Special Topics 212: 35–48.
Bagler, Ganesh. 2008. “Analysis of the Airport Network of
India as a Complex Weighted Network.”Physica A:
Statistical Mechanics and Its Applications 387 (12): 2972–80.
Bagler, Ganesh, and Somdatta Sinha. 2005. “Network Properties of
Protein Structures.”Physica A: Statistical Mechanics and Its
Applications 346 (12): 27–33. https://doi.org/http://dx.doi.org/10.1016/j.physa.2004.08.046.
Barabasi, Albert-Laszlo. 2013. “Network Science.”Philosophical Transactions of the Royal Society A:
Mathematical,Physical and Engineering Sciences 371 (1987). https://doi.org/10.1098/rsta.2012.0375.
Barabâsi, Albert-Laszlo, Hawoong Jeong, Zoltan Néda, Erzsebet Ravasz,
Andras Schubert, and Tamas Vicsek. 2002. “Evolution of the Social
Network of Scientific Collaborations.”Physica A: Statistical
Mechanics and Its Applications 311 (3-4): 590–614.
Blondel, Vincent D, Jean-Loup Guillaume, Renaud Lambiotte, and Etienne
Lefebvre. 2008. “Fast Unfolding of Communities in Large
Networks.”Journal of Statistical Mechanics: Theory and
Experiment 2008 (10): P10008.
Boccaletti, Stefano, Vito Latora, Yamir Moreno, Martin Chavez, and D-U
Hwang. 2006. “Complex Networks: Structure and Dynamics.”Physics Reports 424 (4): 175–308.
Bounova, Gergana Assenova. 2009. “Topological Evolution of
Networks: Case Studies in the US Airlines and Language
Wikipedias.” PhD thesis, Department of Aeronautics; Astronautics,
Massachusetts Institute of Technology.
Bullmore, Ed, and Olaf Sporns. 2009. “Complex Brain Networks:
Graph Theoretical Analysis of Structural and Functional Systems.”Nature Reviews Neuroscience 10 (3): 186–98.
Burghouwt, Guillaume, and Jacco Hakfoort. 2001. “The Evolution of
the European Aviation Network.”Journal of Air
Transport Management 7 (5): 311–18.
Burghouwt, Guillaume, Jacco Hakfoort, and Jan Ritsema van Eck. 2003.
“The Spatial Configuration of Airline Networks in
Europe.”Journal of Air Transport
Management 9 (5): 309–23.
Callaway, Duncan S, Mark EJ Newman, Steven H Strogatz, and Duncan J
Watts. 2000. “Network Robustness and Fragility: Percolation on
Random Graphs.”Physical Review Letters 85 (25): 5468.
Cheung, Dorothy P., and Mehmet Hadi Gunes. 2012. “A Complex Network Analysis of the United States Air
Transportation.” In Advances in Social Networks
Analysis and Mining (ASONAM), 2012 IEEE/ACM International Conference
on, 699–701. https://doi.org/10.1109/ASONAM.2012.116.
Chi, Li-Ping, Ru Wang, Hang Su, Xin-Ping Xu, Jin-Song Zhao, Wei Li, and
Xu Cai. 2003. “Structural Properties of US
Flight Network.”Chinese Physics Letters 20 (8):
1393. http://stacks.iop.org/0256-307X/20/i=8/a=362.
Cimini, Giulio, Tiziano Squartini, Fabio Saracco, Diego Garlaschelli,
Andrea Gabrielli, and Guido Caldarelli. 2019. “The Statistical
Physics of Real-World Networks.”Nature Reviews Physics
1 (1): 58–71.
Clark, Kevin L, Udit Bhatia, Evan A Kodra, and Auroop R Ganguly. 2018.
“Resilience of the US National Airspace System Airport
Network.”IEEE Transactions on Intelligent Transportation
Systems 19 (12): 3785–94. https://ieeexplore.ieee.org/document/8306449.
Clauset, Aaron, Cosma Rohilla Shalizi, and Mark E. J. Newman. 2009.
“Power-Law Distributions in Empirical Data.”SIAM
Review 51 (4): 661–703.
Clusella, Pau, Peter Grassberger, Francisco J. Pérez-Reche, and Antonio
Politi. 2016. “Immunization and Targeted Destruction of Networks
Using Explosive Percolation.”Phys. Rev. Lett. 117
(November): 208301. https://doi.org/10.1103/PhysRevLett.117.208301.
Cohen, Reuven, Keren Erez, Daniel Ben-Avraham, and Shlomo Havlin. 2000.
“Resilience of the Internet to Random Breakdowns.”Physical Review Letters 85 (21): 4626.
Cong, Wei, Minghua Hu, Bin Dong, Yanjun Wang, and Cheng Feng. 2016.
“Empirical Analysis of Airport Network and Critical
Airports.”Chinese Journal of Aeronautics 29 (2):
512–19. https://doi.org/https://doi.org/10.1016/j.cja.2016.01.010.
Conti, Edoardo, Steve Cao, and AJ Thomas. 2013. “Disruptions in
the US Airport Network.”arXiv Preprint arXiv:1301.2223.
https://arxiv.org/abs/1301.2223.
Costa, Luciano da Fontoura, Osvaldo N Oliveira Jr, Gonzalo Travieso,
Francisco Aparecido Rodrigues, Paulino Ribeiro Villas Boas, Lucas
Antiqueira, Matheus Palhares Viana, and Luis Enrique Correa Rocha. 2011.
“Analyzing and Modeling Real-World Phenomena with Complex
Networks: A Survey of Applications.”Advances in Physics
60 (3): 329–412.
Costa, Luciano da F, Francisco A Rodrigues, Gonzalo Travieso, and
Paulino Ribeiro Villas Boas. 2007. “Characterization of Complex
Networks: A Survey of Measurements.”Advances in Physics
56 (1): 167–242.
Deng, Yu. 2021. “Scheduled Freighter Network Analysis of Chinese
Cargo Airlines in the Course of COVID-19 Pandemic.” In
Proceedings of the Air Transport Research Society (ATRS) 24th Annual
World Conference.
Ersoz, Cem, Sena Kilic, and Huseyin Onder Aldemir. 2022. “Analysis
of Turkey’s Airport Network Structure and Centrality in the Opening-Out
Period After the First Wave of COVID-19: A Complex Network
Approach.”Case Studies on Transport Policy 10 (4):
2506–18.
Gautreau, Aurelien, Alain Barrat, and Marc Barthélemy. 2009.
“Microdynamics in Stationary Complex Networks.”Proceedings of the National Academy of Sciences 106 (22):
8847–52.
Guida, Michele, and Funaro Maria. 2007. “Topology of the
Italian Airport Network: A Scale-Free Small-World Network
with a Fractal Structure?”Chaos, Solitons &
Fractals 31 (3): 527–36. https://doi.org/http://dx.doi.org/10.1016/j.chaos.2006.02.007.
Guimera, Roger, Stefano Mossa, Adrian Turtschi, and LA Nunes Amaral.
2005. “The Worldwide Air Transportation Network: Anomalous
Centrality, Community Structure, and Cities’ Global Roles.”Proceedings of the National Academy of Sciences 102 (22):
7794–99.
Gurtner, Gérald, Stefania Vitali, Marco Cipolla, Fabrizio Lillo, Rosario
Nunzio Mantegna, Salvatore Micciche, and Simone Pozzi. 2014.
“Multi-Scale Analysis of the European Airspace Using Network
Community Detection.”PloS One 9 (5): e94414.
Han, Ding-Ding, Jiang-Hai Qian, and Jin-Gao Liu. 2007. “Network Topology of the Austrian Airline
Flights.”arXiv:physics/0703193.
He, Yangyang. 2022. “Evolution of International Cargo Charter
Flights Under COVID-19 Pandemic Impacted Environment in China.”
In Proceedings of the Air Transport Research Society (ATRS) 25th
Annual World Conference.
Isard, Walter. 1954. “Location Theory and Trade Theory: Short-Run
Analysis.”The Quarterly Journal of Economics 68 (2):
305–20.
Jia, Tao, and Albert-László Barabási. 2013. “Control Capacity and
a Random Sampling Method in Exploring Controllability of Complex
Networks.”Scientific Reports 3: 2354. https://doi.org/10.1038/srep02354.
Jia, Tao, and Bin Jiang. 2012. “Building and Analyzing the
US Airport Network Based on En-Route Location
Information.”Physica A: Statistical Mechanics and Its
Applications 391 (15): 4031–42. https://doi.org/http://dx.doi.org/10.1016/j.physa.2012.03.006.
Jia, Tao, Kun Qin, and Jie Shan. 2014. “An Exploratory Analysis on
the Evolution of the US Airport Network.”Physica A: Statistical Mechanics and Its Applications 413 (0):
266–79. https://doi.org/http://dx.doi.org/10.1016/j.physa.2014.06.067.
Jimenez, Edgar. 2022. “An in-Depth Analysis of Multi-Layer
Interactions in the Domestic Air Transport Network of China:
2009-2019.” In Proceedings of the Air Transport Research
Society (ATRS) 25th Annual World Conference.
Jimenez, Edgar, João Claro, and Jorge Pinho de Sousa. 2012.
“Spatial and Commercial Evolution of Aviation Networks: A Case
Study in Mainland Portugal.”Journal of Transport
Geography 24: 383–95.
Kim, Seyun. 2019. “Robustness Analysis of the Northeast Asian Air
Transport Network as a Complex Network.” In Proceedings of
the Air Transport Research Society (ATRS) 23th Annual World
Conference.
Klophaus, Richard. 2017. “Network Vulnerability Analysis of Star
Alliance, Oneworld and Skyteam.” In Proceedings of the Air
Transport Research Society (ATRS) 21th Annual World Conference.
Latora, Vito, and Massimo Marchiori. 2001. “Efficient Behavior of
Small-World Networks.”Physical Review Letters 87 (19):
198701.
Li, Junru. 2021. “The Morphological Structure and Influence
Factors Analysis of China’s Civil Aviation Freight Transport
Network.” In Proceedings of the Air Transport Research
Society (ATRS) 24th Annual World Conference.
Li, Wei, and Xu Cai. 2004. “Statistical Analysis of Airport
Network of China.”Physical Review E 69:
046106.
Li, Wei, Qiuping A. Wang, Laurent Nivanen, and Alain Le Mehaute. 2006.
“How to Fit the Degree Distribution of the Air Network?”Physica A: Statistical Mechanics and Its Applications 368 (1):
262–72. https://doi.org/http://dx.doi.org/10.1016/j.physa.2005.11.050.
Liao, Maozhu. 2021. “Network Change of Low-Cost Carriers During
the Post COVID-19 Era.” In Proceedings of the Air Transport
Research Society (ATRS) 24th Annual World Conference.
Lin, Jingyi, and Yifang Ban. 2013. “Complex Network Topology of
Transportation Systems.”Transport Reviews 33 (6):
658–85.
———. 2014. “The Evolving Network Structure of US
Airline System During 1990–2010.”Physica A: Statistical
Mechanics and Its Applications 410 (0): 302–12. https://doi.org/http://dx.doi.org/10.1016/j.physa.2014.05.040.
Luxen, Dennis, and Christian Vetter. 2011. “Real-Time Routing with
OpenStreetMap Data.” In Proceedings of the 19th ACM
SIGSPATIAL International Conference on Advances in Geographic
Information Systems, 513–16. GIS ’11. New York, NY, USA:
Association for Computing Machinery. https://doi.org/10.1145/2093973.2094062.
Marzuoli, Aude, Eric Feron, and Emmanuel Boidot. 2014. “Resilience
of the National Airspace System Structure: A Data-Driven Network
Approach.”AIAA/IEEE Digital Avionics Systems Conference -
Proceedings, December, 1D21–213. https://doi.org/10.1109/DASC.2014.6979413.
Neal, Zachary. 2013. “Evolution of the Business Air Travel Network
in the US from 1993 to 2011: A Descriptive Analysis Using
AIRNET.”Research in Transportation Business
& Management 9 (0): 5–11. https://doi.org/http://dx.doi.org/10.1016/j.rtbm.2013.05.002.
———. 2014. “The Devil Is in the Details: Differences in Air
Traffic Networks by Scale, Species, and Season.”Social
Networks 38: 63–73.
Newman, Mark EJ. 2010. Networks-an Introduction. Oxford
University Press.
Pagani, Giuliano Andrea, and Marco Aiello. 2013. “The Power Grid
as a Complex Network: A Survey.”Physica A: Statistical
Mechanics and Its Applications 392 (11): 2688–2700.
Paleari, Stefano, Renato Redondi, and Paolo Malighetti. 2010. “A
Comparative Study of Airport Connectivity in China,
Europe and US: Which Network Provides the Best
Service to Passengers?”Transportation Research Part E:
Logistics and Transportation Review 46 (2): 198–210.
https://doi.org/http://dx.doi.org/10.1016/j.tre.2009.08.003.
Palla, Gergely, Imre Derényi, Illés Farkas, and Tamás Vicsek. 2005.
“Uncovering the Overlapping Community Structure of Complex
Networks in Nature and Society.”Nature 435 (7043):
814–18.
Papatheodorou, Andreas, and Pavlos Arvanitis. 2009. “Spatial
Evolution of Airport Traffic and Air Transport Liberalisation: The Case
of Greece.”Journal of Transport Geography
17 (5): 402–12. https://doi.org/http://dx.doi.org/10.1016/j.jtrangeo.2008.08.004.
Qian, Bingxue, and Ning Zhang. 2022. “Topology and Robustness of
Weighted Air Transport Networks in Multi-Airport Region.”Sustainability 14 (11): 6832.
Quartieri, Joseph, Michele Guida, Claudio Guarnaccia, Salvatore
D’Ambrosio, and Davide Guadagnuolo. 2008a. “Complex Network
Applications to the Infrastructure Systems: The Italian
Airport Network Case.” In Proc. Of the Int. Conf. On Urban
Planning and Transportation, Heraklion, Crete Island, Greece.
———. 2008b. “Topological Properties of the Italian
Airport Network Studied via Multiple Addendials and Graph
Theory.”International Journal of Mathematical Models and
Methods in Applied Sciences 2: 312–16.
Requião da Cunha, Juan Carlos AND Gonçalves, Bruno AND González-Avella.
2015. “Fast Fragmentation of Networks Using Module-Based
Attacks.”PLOS ONE 10 (11): 1–15. https://doi.org/10.1371/journal.pone.0142824.
Rocha, Luis EC. 2017. “Dynamics of Air Transport Networks: A
Review from a Complex Systems Perspective.”Chinese Journal
of Aeronautics 30 (2): 469–78.
Rocha, Luis EC da. 2009. “Structural Evolution of the
Brazilian Airport Network.”Journal of
Statistical Mechanics: Theory and Experiment 2009 (04): P04020.
Sallan, Jose M. 2017. “Cascading Failures in Air Transport
Networks.” In Proceedings of the Air Transport Research
Society (ATRS) 21th Annual World Conference.
Sampaio, Francisco Claudio. 2022. “Resilience Analysis of Air
Traffic Systems Based on Complex Networks.” In Proceedings of
the Air Transport Research Society (ATRS) 25th Annual World
Conference.
Sun, Xiaoqian, and Sebastian Wandelt. 2021. “Robustness of Air
Transportation as Complex Networks: Systematic Review of 15 Years of
Research and Outlook into the Future.”Sustainability 13
(11): 6446.
Sun, Xiaoqian, Sebastian Wandelt, Mark Hansen, and Ang Li. 2017.
“Multiple Airport Regions Based on Inter-Airport Temporal
Distances.”Transportation Research Part E: Logistics and
Transportation Review 101: 84–98.
Sun, Xiaoqian, Sebastian Wandelt, and Florian Linke. 2015.
“Temporal Evolution Analysis of the European Air Transportation
System: Air Navigation Route Network and Airport Network.”Transportmetrica B: Transport Dynamics 3 (2): 153–68.
Sun, Xiaoqian, Sebastian Wandelt, and Massimiliano Zanin. 2017.
“Worldwide Air Transportation Networks: A Matter of Scale and
Fractality?”Transportmetrica A: Transport Science 13
(7): 607–30. https://doi.org/10.1080/23249935.2017.1312632.
Sun, Xiaoqian, Sebastian Wandelt, and Anming Zhang. 2020a. “How did COVID-19 impact air transportation? A first peek
through the lens of complex networks.”Journal
of Air Transport Management 89: 101928. https://doi.org/https://doi.org/10.1016/j.jairtraman.2020.101928.
———. 2020b. “Resilience of Cities Towards Airport Disruptions at
Global Scale.”Research in Transportation Business &
Management 34: 100452. https://doi.org/https://doi.org/10.1016/j.rtbm.2020.100452.
Takada, Kazuyuki. 2017. “Reasearch on the Transition of Aviation
Network Structure in Japan.” In Proceedings of the Air
Transport Research Society (ATRS) 21th Annual World Conference.
Thompson, Ian B. 2002. “Air Transport Liberalisation and the
Development of Third Level Airports in France.”Journal of Transport Geography 10 (4): 273–85.
https://doi.org/http://dx.doi.org/10.1016/S0966-6923(02)00043-1.
Toledo, Fernanda. 2021. “Towards on Multiplex Networks and
Applications.” In Proceedings of the Air Transport Research
Society (ATRS) 24th Annual World Conference.
Wandelt, Sebastian, Xiaoqian Sun, and Xianbin Cao. 2015.
“Computationally Efficient Attack Design for Robustness Analysis
of Air Transportation Networks.”Transportmetrica A:
Transport Science 11 (10): 939–66. https://doi.org/10.1080/23249935.2015.1089953.
Wandelt, Sebastian, Xiaoqian Sun, Daozhong Feng, Massimiliano Zanin, and
Shlomo Havlin. 2018. “A Comparative Analysis of Approaches to
Network-Dismantling.”Scientific Reports 8 (1): 1–15.
Wandelt, Sebastian, Xiaoqian Sun, and Jun Zhang. 2019. “Evolution
of Domestic Airport Networks: A Review and Comparative Analysis.”Transportmetrica B: Transport Dynamics 7 (1): 1–17. https://doi.org/10.1080/21680566.2017.1301274.
Wang, Jiaoe, Huihui Mo, and Fahui Wang. 2014. “Evolution of Air
Transport Network of China 1930–2012.”Journal of Transport
Geography 40 (0): 145–58. https://doi.org/http://dx.doi.org/10.1016/j.jtrangeo.2014.02.002.
Wang, Jiaoe, Huihui Mo, Fahui Wang, and Fengjun Jin. 2011. “Exploring the network structure and nodal centrality of
China’s air transport network: A complex network
approach.”Journal of Transport Geography 19 (4):
712–21.
Wen, Xiangxi, Congliang Tu, and Minggong Wu. 2018. “Node
Importance Evaluation in Aviation Network Based on ‘No
Return’ Node Deletion Method.”Physica A: Statistical
Mechanics and Its Applications 503: 546–59. https://www.sciencedirect.com/science/article/pii/S0378437118301997.
Wong, Allen, Sijian Tan, Keshav Ram Chandramouleeswaran, and Huy T Tran.
2020. “Data-Driven Analysis of Resilience in Airline
Networks.”Transportation Research Part E: Logistics and
Transportation Review 143: 102068. https://www.sciencedirect.com/science/article/pii/S1366554520307195.
Xu, Zengwang, and Robert Harriss. 2008. “Exploring the Structure
of the U.S. Intercity Passenger Air Transportation Network:
A Weighted Complex Network Approach.”GeoJournal 73 (2):
87–102. https://doi.org/10.1007/s10708-008-9173-5.
Zanin, Massimiliano. 2014. “Network Analysis Reveals Patterns
Behind Air Safety Events.”Physica A: Statistical Mechanics
and Its Applications 401 (0): 201–6. https://doi.org/http://dx.doi.org/10.1016/j.physa.2014.01.032.
———. 2015. “Can We Neglect the Multi-Layer Structure of Functional
Networks?”Physica A: Statistical Mechanics and Its
Applications 430: 184–92. https://doi.org/http://dx.doi.org/10.1016/j.physa.2015.02.099.
Zanin, Massimiliano, and Fabrizio Lillo. 2013. “Modelling the Air
Transport with Complex Networks: A Short Review.”The
European Physical Journal Special Topics 215 (1): 5–21. https://doi.org/10.1140/epjst/e2013-01711-9.
Zhang, Hai-Tian, Tao Yu, Jian-Ping Sang, and Xian-Wu Zou. 2014.
“Dynamic Fluctuation Model of Complex Networks with Weight Scaling
Behavior and Its Application to Airport Networks.”Physica A:
Statistical Mechanics and Its Applications 393 (0): 590–99.
https://doi.org/http://dx.doi.org/10.1016/j.physa.2013.09.005.
Zhang, Yimin. 2010. “Network Structure and Capacity Requirement:
The Case of China.”Transportation Research Part
E: Logistics and Transportation Review 46 (2): 189–97.
https://doi.org/http://dx.doi.org/10.1016/j.tre.2009.08.002.
Appendix
Figure 16: Network visualization of cities (CIT) based on
data for April - June 2022. Top 20 nodes with the highest number of
connections are highlighted by their IATA code. Figure 17: Network visualization of multiple-airport regions
(MAR) based on data for April - June 2022. Top 20 nodes with the highest
number of connections are highlighted by their IATA code.