ANSPs in Turbulent Times - Uncovering the Impact of Demand Shocks on Efficiency Using the Malmquist Index
Thomas Standfuss[1], Frank Fichert[2], Georg Hirte[3] and Hartmut Fricke[1] [1]TU Dresden, Chair of Aviation Technology and Logistics [2]Worms University of Applied Sciences [3]TU Dresden, Chair of Economics, esp. Transport Policy and Spatial Economics
Abstract: Global and local shocks such as COVID-19 or the Russian attack on Ukraine have influenced European air transport, and other shocks will appear in the future. The subsequent traffic shifts affect one bottleneck candidate of the system: the Air Navigation Service Providers (ANSP). In this paper, we apply productivity metrics and Malmquist Data Envelopment Analysis to examine how the ANSP related performance of the air transport system has changed between 2008 and 2020. By considering different levels of granularity we demonstrate the tremendous influence that shocks may have on demand figures and, subsequently, on performance metrics. As an example we show that the Corona pandemic had disparate impacts on various units, resulting in notable efficiency losses in 2020, however, with a strong variation between ANSPs. The findings of our study can be utilized in a subsequent root-cause analysis to quantify the impacts of both endogenous and exogenous factors on performance. This in turn will provide valuable insights for policymakers and industry stakeholders in managing air transport during and after such shocks, and to create a more resilient air traffic management system.
Keywords:Efficiency;ATM;Panel Analysis;Malmquist;Data Envelopment Analysis;External Shocks Citation:Standfuss, T., Fichert, F., Hirte, G., and Fricke, H. (2023). ANSPs in Turbulent Times - Uncovering the Impact of Demand Shocks on Efficiency Using the Malmquist Index. Journal of the Air Transport Research Society 1(1): 101-116 DOI:https://dx.doi.org/10.59521/77F179283F5A9C63 Download:PDF
1 Introduction
In the 1990s, the liberalization of European air transport markets
led to a significant increase in demand for air travel. However, this
has resulted in capacity constraints in the busiest airspaces.
Furthermore, the increasing market share of Low Cost Carriers
contributed to an increasing cost pressure. As a result, more attention
is being paid to the performance evaluation of the European Air Traffic
Management (ATM), which is often regarded as being both costly and
inefficient. Despite numerous institutional, academic, and operational
studies, a complete picture of efficiency drivers has yet to be
established. The majority of analyses primarily address air navigation
service provider (ANSP) related activities, comprising i.a. air traffic
control service provision, which is often considered as a bottleneck of
the ATM system. The ANSPs, which are financed via charges paid by
airspace users, are responsible for managing the scarce resource of
airspace capacity. EUROCONTROL publishes annual reports on operational
and financial performance. Academic studies have focused on improving
the related benchmarking methodology and identifying potential causes of
inefficiencies as well as savings that might result from efficiency
improvements. Therefore, the publications have focused on specific
aspects, such as the structuring of airspace. Since in general each
country has designated one ANSP for its airspace, the European system is
highly heterogeneous in terms of the systems used, training content,
procedures, culture and working methods. This has resulted in
significant spatial, technical and administrative fragmentation of the
European air traffic management (ATM) (EUROCONTROL and
FAA 2016; Standfuss et al. 2019; Rezo, Steiner, and Piccioni
2020). Studies applying a more holistic approach indicate that
numerous other factors contribute to inefficiency. This is hardly
surprising, since European ATM involves - as stated - many stakeholders,
each with their own (partially conflicting) particular objectives beyond
the fundamental performance criteria set out by the SES Performance
Scheme (European
Commission 2013; EUROCONTROL 2021c). Additionally, events such as
wars (Prakasa et al.
2022), economic crises (Pearce 2012), or natural disasters (Lechner et al. 2017)
can trigger shocks that vary in their spatial and temporal spread. These
shocks can also influence the performance of the ATM system.
Shocks are typically characterized by sudden and significant changes
in demand or its distribution, often limited to a particular area or
country and its neighboring regions. However, the COVID-19 pandemic was
an extraordinary global crisis that impacted the entire world. One of
the notable impacts was the substantial decline in European air traffic
figures, ranging from -37% (Norway) to -70% (Armenia) (EUROCONTROL
2022). Such fluctuations can have a detrimental effect on
efficiency, particularly since demand tends to fluctuate more rapidly
than resources can be adjusted. To enhance the system’s resilience, it
is essential to quantify the resulting change in efficiency and to
examine potential influencing factors. In this paper, we focus on the
former and employ the Malmquist index to demonstrate that efficiency
losses of ANSPs varied with respect to their magnitude. These findings
will be utilized in a subsequent step, which involves an extensive root
cause analysis, to be detailed in a separate paper due to its extensive
scope.
This paper builds upon a preliminary study that focuses on ANSP
benchmarking (Standfuss, Hirte, and Schultz 2022).
The authors have recommended that performance benchmarking of air
traffic control services should be conducted using a data envelopment
analysis (DEA). For this analysis only operational variables should be
used, and removing outlier units from the dataset is crucial for
achieving meaningful results. Building on these findings, the present
study applies the suggested methods and economic models while monitoring
the results over time and analyzing the effects of scaling and technical
progress. Thus, this study provides an important link to the root cause
analysis, in which the performance values calculated serve as input
variables for a regression. The overall approach offers three major
benefits: Firstly, it enables us to examine changes in performance over
time. Secondly, it has methodological benefits, such as accounting for
unobserved heterogeneity. Lastly, panel datasets enhance the number of
observations, which is expected to increase the statistical significance
of the results. The last two arguments primarily pertain to the root
cause analysis. Nevertheless, certain fluctuations in performance can
probably be attributed to events. For instance, a decline in
productivity and efficiency could be expected during the 2008 financial
crisis and the COVID-19 pandemic in 2020.
Our study seeks to address two primary research questions. First, how
has the performance of European air navigation service providers
developed over recent years? Second, can significantly varying
performance values be attributed to local or global geopolitical,
natural, or economic events (qualitative analysis)? To provide context
for the study, the next section provides a literature review. Section 3
offers a brief overview of air navigation service operations. Section 4
discusses the data and benchmarking method used in this study, while
Section 5 presents the results. In Section 6, we summarize our findings
and provide an outlook for future research.
2 Literature Review
Evaluating and comparing the performance of companies is a key task
in economics. In most cases, performance is expressed either by
productivity or efficiency. Productivity is measured as the ratio of
goods produced or services provided (outputs) to the resources used to
produce them (inputs). Higher values indicate a higher productivity.
Although the use of absolute values makes them easily comparable, the
explanatory power of benchmarking results might be limited if the units
differ significantly e.g., in size or with respect to the economic
environment1. Efficiency analysis aims to
identify potential room for improvement by comparing the performance of
a unit with that of the best in class. The subsequent metric is a
relative performance, limited between 0 and 1, respectively 0% and
100%2. If the unit’s performance
represents best in class, it is considered efficient (100). Otherwise,
the unit can strive to either reduce input or increase output in order
to become efficient. Further details regarding the methodology employed
in this study will be presented in Section 4.
The academic literature provides various approaches for assessing the
performance of decision-making units (DMU). In economics, a common
practice is the so-called "two-stage analysis" (Zhu 2014). In the first stage, the
performance of the unit is determined by means of a previously defined
metric. The second stage then examines which influencing factors exist
and how they affect the performance score in terms of sign (does the
factor have a positive or negative effect on the performance), strength
(how high is the influence), and statistical significance (is this
relationship statistically verifiable or rather random). The present
study primarily focuses on the first stage, with a qualitative analysis
of the results. The analysis of ANSP performance (first stage) was
introduced some 20 years ago by the European Organisation for the Safety
of Air Navigation EUROCONTROL, and disseminated in annual reports, e.g.,
(EUROCONTROL 2019a,
2020c). However, these reports use a simple index method that
only provides limited and incomplete insights (Standfuss, Hirte, and Schultz 2022).
Furthermore, the reports compare units (ANSPs) that exhibit a high
degree of heterogeneity in terms of the services offered, operational
size, and environmental influences such as role of unions or wage
effects (see also Table 1). Metrics
used in the comparison must also be critically scrutinized. As one
example, the ATCO productivity measure uses a composite measure to
aggregate flight hours and airport movements. Despite the fact that the
share of both services may vary significantly among the units, a
pan-European weighting factor is used.
Collaborative studies with the Federal Aviation Administration (FAA)
have compared the operational (EUROCONTROL and FAA 2019a) and
financial (EUROCONTROL and FAA 2019b)
performance of ANSPs in European and US American airspaces.
Additionally, (EUROCONTROL and FAA 2021)
conducted an analysis of the impact of COVID-19 in both airspaces. The
findings suggest that efficiency in the US airspace is generally
perceived as being higher, highlighting the need for a more harmonized
air traffic management system and reduced fragmentation in Europe.
Furthermore, it has been observed that the US system appears to be more
resilient, as it experienced a lower impact from the COVID-19 pandemic
compared to the European service providers. However, there a significant
differences between Europe and the US in terms of operations and
funding. Without appropriate adjustment of the data, an accurate
efficiency assessment is unachievable. This point has been emphasized by
(Standfuss and
Whittome 2019). The authors were able to demonstrate that the
proclaimed difference in performance between the two airspaces is much
smaller, and in some cases even reversed, when operational and financial
characteristics are adjusted. Moreover, (Whittome and Standfuss 2018) showed
that European ANSPs would have a 70% higher funding at their disposal in
case the American financing concept were applied in Europe3.
Significant weaknesses were identified regarding the COVID-19 study as
well. (FABEC
2021a) pointed out that the decline in the number of flights
during the pandemic can be attributed to the drop in demand. This in
turn was influenced by country-specific regulations such as contact
restrictions, travel bans, and other measures related to COVID-19. These
restrictions were particularly stringent in Europe, with varying degrees
of strictness implemented in almost all European countries. In contrast,
the United States government opted for less far-reaching measures, which
had positive effects on domestic air traffic. In consequence, the
observed differences in resilience may be largely attributed to policy
implications and thus exogenous effects related to COVID-19 measures,
rather than to a (proclaimed) higher efficiency.
Academic studies particularly improved the assessment methodology,
applying e.g., Data Envelopment Analysis (DEA) (Arnaldo et al. 2014; Standfuss,
Hirte, and Schultz 2022), or Stochastic Frontier Analysis (SFA)
(Blondiau et
al. 2016; NERA 2006). However, the latter requires ex-ante
assumptions with regard to the production or cost function. Since
ex-ante assumptions are challenging, there is the risk of model
misspecification. Thus, (Standfuss, Hirte, and Schultz 2022)
argue that the application of the deterministic, non-parametric Data
Envelopment Analysis represents the most appropriate approach4. Over the past decades, researchers
have developed various DEA approaches. As one example, the
super-efficiency DEA enables efficiency values of over 100%. This
approach has two main advantages: First, efficient units can also be
ranked; second, this analysis helps to find outliers and oddities.
Additive or multiplicative models, e.g., the slack-based DEA (Tone 2001), combine input
and output orientation (Zhu
2014). As a non-parametric approach, DEA provides no measures of
model quality. Therefore, (Bogetoft and Otto 2011) developed the
bootstrap DEA, a stochastically ‘corrected’ or ‘adjusted’ production
function is generated. However, according to Coelli et al. (2005), the bootstrap
algorithm should not be applied in the case of empirically gathered
data.
Since DEA is frequently used to determine efficiency (first stage),
various publications deal with the appropriate second-stage method.
(Simar and Wilson
2007) analyzed and compared different regression techniques,
including Ordinary-Least-Squares (OLS), Truncated and Tobit models. They
also tested different data transformations, particularly the
log-transformation of DEA values. The authors recommend a truncated
model for regression based on a DEA. Further, (Banker and Natarajan 2008) compared
different second stage approaches. The authors showed that deterministic
methods are superior to parametric approaches. The most common approach
is applying DEA in combination with a Tobit regression, e.g., (Spaho 2015), although
(Hoff 2007)
demonstrated that these models perform similarly to OLS models. Further
academic studies primarily dealt with specific aspects of efficiency
influencing factors (second stage) and how to improve efficiency. As an
example, (Starita et al. 2021;
Button and Neiva 2013; Standfuss et al. 2019) analyze potential
improvements by achieving economies of scale through airspace mergers
and an improved cooperation. Other studies examined the efficiency gains
through the privatization of ANSPs (Buyle 2022), alternative financing
concepts (Verbeek
2017), dynamic sectorization, (Gerdes, Temme, and Schultz 2018),
flight-centric ATC (Birkmeier and Korn 2014; Névir
2022), or alternative market designs (Adler, Hanany, and Proost 2022).
Furthermore, (Rezo et al.
2023) identified and discussed shortcomings in one of
EUROCONTROL’s key performance areas, specifically capacity. The authors
proposed the use of spatially-oriented performance indicators, as their
findings revealed that the attainment of performance targets is
influenced by neighboring air navigation service providers.
Several publications have examined the impacts of global and local
shocks on the aviation industry, such as the COVID-19 pandemic and the
Russian attack on Ukraine. For instance, (Bugayko et al. 2023) examine three
proactive risk management scenarios for ensuring sustainability after
the end of the war. Similarly, (Sun, Wandelt,
and Zhang 2021; Ölçen and Alnipak 2023; Linden 2021; Andribet,
Baumgartner, and Garot 2022) discuss various strategies for
managing pandemic-induced shocks, with a focus on the COVID-19 outbreak,
e.g., to create a more resilient ATM system. The eruption of
Eyjafjallajökull volcano in Iceland in 2010, and the resulting ash
cloud, had a profound impact on air traffic, disrupting operations for
three months. Despite being a rather local event, it caused significant
global economic consequences. (Reichardt, Ulfarsson, and Pétursdóttir
2021) utilized this case as a basis to create and discuss several
scenarios aimed at assessing the resilience of the aviation industry.
While these studies offer some valuable insights, they primarily rely on
qualitative approaches and/or focus on one efficiency driver rather than
following a holistic approach.
It should be noted that the majority of studies, including this
paper, assess the ANSP level5. Nevertheless, there are
some investigations addressing fundamental aspects of capacity provision
in ACCs (FABEC
2021b) or specific efficiency drivers (FABEC 2018). Further, (Standfuss, Fichert, and
Schultz 2017) provided a methodical approach how to benchmark
performance at disaggregated levels. Cross-sectional data analysis, as
used in the studies mentioned above, can provide valuable insights into
the efficiency of different units during a particular time period.
However, this approach does not account for time effects that may impact
efficiency values over time. One study by (Bilotkach et al. 2015) utilized
Malmquist analysis to evaluate efficiency using data from 2002 to 2011.
The study employed "controlled flight hours" and "aircraft movements at
the airport" as outputs, and gate-to-gate ATM/CNS costs as input. The
study also incorporated input prices for controllers, personnel,
capital, and other resources to assess allocative efficiency. However
(Standfuss
2021) discovered that the data is not reliable when collected
before 20086. In addition, the author suggest
avoiding the use of monetary inputs or outputs (see also (Standfuss, Hirte, and
Schultz 2022)).
3 Provision of Air Navigation
Services
European airspace is among the busiest in the world, and despite a
significant reduction in traffic due to COVID-19, demand is now
recovering rapidly. In addition, the spatial distribution of traffic
remains uneven, with a significant concentration in the core area of
Europe, where seven major airports, including London Heathrow,
Frankfurt, and Paris Charles de Gaulle, are located within a 1,000 km
diameter. To meet the growing demand for and operational performance
requirements of air traffic, an ANSP aims to apply smart procedures and
tools to provide sufficient capacity while both ensuring a safe and
orderly flow of traffic and keeping operational costs low. One paramount
goal is to minimize the risk of aircraft collisions. Therefore, ATC uses
sequencing and metering techniques to build efficient flows by
separating traffic vertically and horizontally. This is a demanding task
especially for ANSPs in the core of Europe facing significant peak
demand figures, posing notable capacity management challenges (EUROCONTROL 2020c,
2023a). ATC itself consists of "terminal" and "enroute" service
units, which differ significantly in their operational procedures. To
manage the complex air traffic, especially in congested areas, the
enroute part is laterally split into multiple operational levels, known
as Area Control Centers (ACC), which themselves comprise multiple sector
groups (SG) and further sectors. Each level has specific objectives, is
subject to constraints, and is subject to environmental influences.
Depending on the organizational size of the respective ANSP, enroute
services are provided in one or more Area Control Centers to cover a
specific part of the airspace. These (geographic) areas are designed
following different characteristics, e.g., traffic flows or specific
altitudes (FABEC
2019). Usually, ACCs are responsible for both upper and lower
airspace. However, there are exceptions: Karlsruhe and Maastricht, for
example, only provide services for the upper airspace, which is why they
are also referred to as Upper Area Control Centre (UAC). It is a common
practice to split or collapse (merge) sectors over time to align
capacity to current demand following sector opening/closing schemes or
configurations, respectively. Splitting a sector in general doubles
variable cost of capacity provision but less than doubles available
capacity. Furthermore, collapsing sectors are operationally limited to
SGs, for which controllers hold a license. Those groups are consequently
referred to as licensed areas. Efficient capacity management by air
navigation service providers is crucial for meeting the demand of
airspace users and requires robust traffic forecasts to plan sufficient
resources, i.e., Air Traffic Control Officers (ATCOs). However, the
decisions of airspace users may contribute to less predictable and
highly volatile traffic flows, posing a permanent challenge to
capacity-demand balancing and ultimately leading to inefficiency.
Additionally, exogenous factors (as stated in Section 1) can lead to
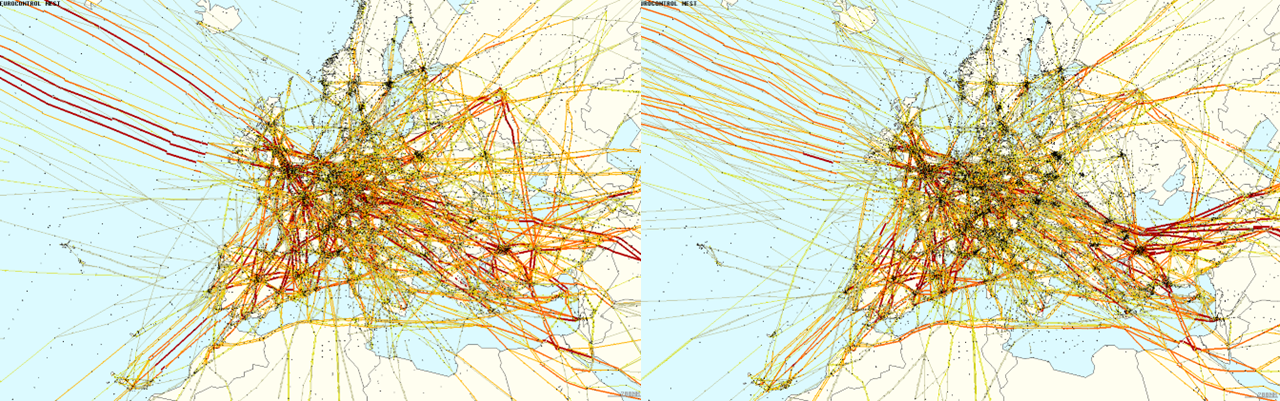
strong fluctuations in demand: Figure 1 depicts a
density plot of flights about two years before and two years after the
downing of MH17 7 over eastern Ukraine and the
annexation of Crimea, based on a simulation using NEST (EUROCONTROL
2020b).
Figure 1: Density Plot of flight trajectories two years
before and two years after the downing of flight MH17 (Nova 2022).
Especially the MH17 occurrence had extensive ramifications on traffic
patterns in Europe. The traffic routes were realigned, using Bulgarian
and Romanian airspace for long-haul flights to Asia. Conversely, there
was a significant reduction in demand for travel to Moldova.
Additionally, Poland and the Baltic states were impacted by diversionary
traffic. It goes without saying that these changes in volume and flow
had a noticeable impact on several key performance indicators, such as
ATCO productivity (ICAO
2018) and horizontal flight efficiency (HFE) (EUROCONTROL 2021b).
The effects of this event were exacerbated by the Russian invasion of
Ukraine in 2022, resulting in the closure of Russian airspace to
numerous airlines. Consequently, there has been a surge in polar flights
and a southward diversion of flights to Asia. This has led to a sharp
decline in ATC demand in the Baltic states, and the partial suspension
of Asian flights by some airlines in Scandinavian countries also
contributes to this external shock. The aforementioned observations
highlight the complexity of ATC, as one component of ATM. This
understanding is crucial when applying benchmarking. It also indicates
that analyzing cross-sectional data - i.e., looking at one time period
only - may be insufficient, since local and global events can
significantly affect performance values. This is particularly
challenging when those effects cannot be quantified. Therefore, panel
data analyses enable a better understanding of how these
(non-quantifiable) shocks affect the individual as well as the
system-wide performance.
4 Approach and Method
For the first stage of the analysis, we consider the operational
level of an ANSP. We will first have a look on productivity scores
designed for and published by (EUROCONTROL 2019a,
2019b). Second, to calculate DEA scores and Malmquist Indices, we
adopt economic models and considerations published by (Standfuss, Hirte, and
Schultz 2022). We do not adjust, substitute or complement the
models. Since the authors found out that special forms of DEA, such as
bootstrap or slack-based techniques, does not improve the process, we
only apply standard DEA. We preferred the DEA method as it is a
non-parametric and deterministic approach that does not require an
a-priori assumption regarding functional relationships between inputs
and outputs, and error terms, which helps to minimize the risk of
incorrect estimates. DEA uses a linear programming approach to generate
a frontier production function that connects all efficient
decision-making units (DMUs), i.e. an ANSP. Inefficient DMUs are
evaluated by their radial distance from the efficient frontier. This
method ensures that inefficient units are compared to their peers, which
are units with equivalent production functions. This prevents the
comparison and evaluation of widely differing technologies. Applying DEA
involves a decision about whether to maximize outputs with given inputs
or to minimize inputs for given outputs. Since the output of ANSPs is
driven by traffic demand, we decided for an input-oriented DEA. We apply
Malmquist DEA because it is capable of measuring efficiency changes over
time, accounting for fluctuations in resource utilization (inputs) and
service provision (outputs). This involves calculating the Malmquist
Index, denoted as M, which is
derived from the ratio of Total Factor Productivity (TFP) at two
different points in time. This index enables us to quantify time-induced
changes in performance and evaluate the relative efficiency of the
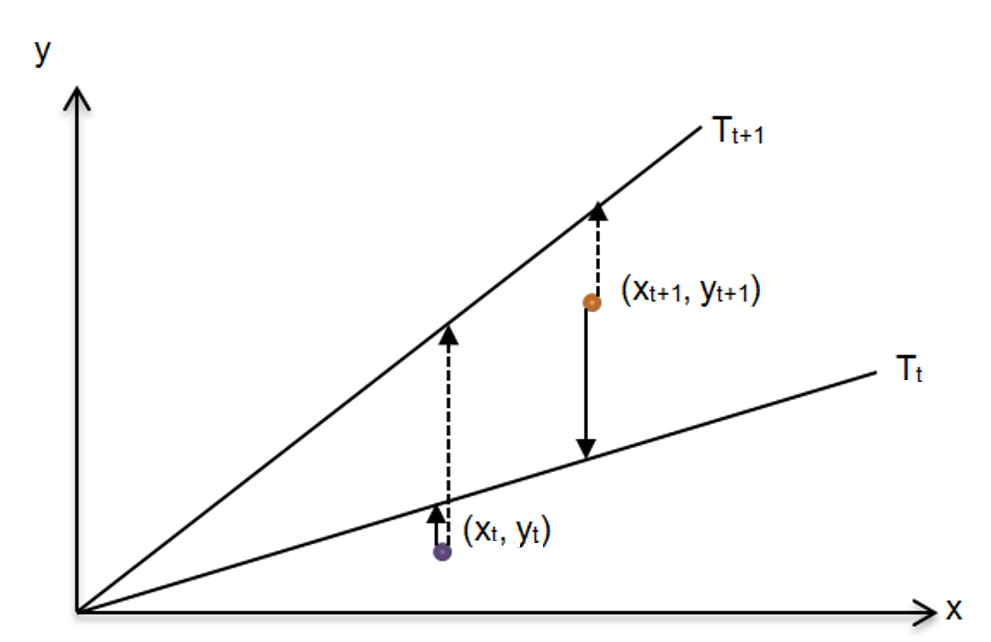
production process at different points in time. The change in TFP (TFPCH)
is determined separately for period 1 (t) and period 2 (t+1), as shown
in Figure 2. The two resulting values are usually not
equal (Färe et al.
1994) and the Malmquist index represents the geometric mean of
both values. That helps to avoid an arbitrary determination of the
reference technology8(Cantner, Krüger, and Hanusch 2007).
Figure 2: Schematic illustration of Malmquist Index, based
on the technology in period t and t+1, implying output orientation and
constant returns to scale (Fried, Lovell, and Schmidt 2008).
Similarly to the efficiency analysis, the Malmquist Index can be
computed either input or output oriented, and is based on distance
functions between a DMU and the efficient frontier. Equation [form:MI] illustrates how the TFP change
rate between two time periods t and t + 1 can be calculated, based on
the input vector x and the
output vector y, and using the
distance function D between
the observed firm and the benchmark technology. M is calculated as the geometric
mean of the two resulting quotients. M above 1 indicates growth in
productivity, equal to 1 stagnation, and below 1 a decrease (Fried, Lovell, and Schmidt
2008).
Both equations assume constant returns to scale (CRS). However, when
analyzing multiple periods, the size of the production unit is variable
as well, which can impact productivity9. To
account for this, DEA calculates the distance between the Decision
Making Unit (DMU) and the variable returns to scale (VRS) production
frontier. This task can be challenging when applying Malmquist DEA
because the convex nature of the frontier functions may lead to
non-reciprocity issues. As a result, the values of efficiency may
differ, as pointed out by (Cantner, Krüger, and Hanusch 2007).
Nonetheless, (Coelli et
al. 2005) demonstrated that it is possible to decompose the
change of technical efficiency under variable returns to scale
assumptions, which is illustrated in Equation [form:SE]. The
calculation of scale efficiency in Malmquist DEA is based on the
decomposition of the left-hand term in Equation [form:TA]. In
general, the scale efficiency is determined by comparing the technical
efficiency scores under VRS and CRS frontiers, as demonstrated by (Coelli et al. 2005).
Assuming variable returns to scale enables the decomposition of
(in)efficiency into both technical and scale components. This approach
is applied in Equation [form:SE], where efficiency is decomposed
into pure technical efficiency (PECH) and
scale efficiency change (SECH).
The latter represents the geometric mean of the two changes in scale
efficiency based on the benchmarks for period 1 and period 2. The "vrs" index
indicates technologies with variable returns to scale, while the "crs" index denotes
those with constant returns to scale.
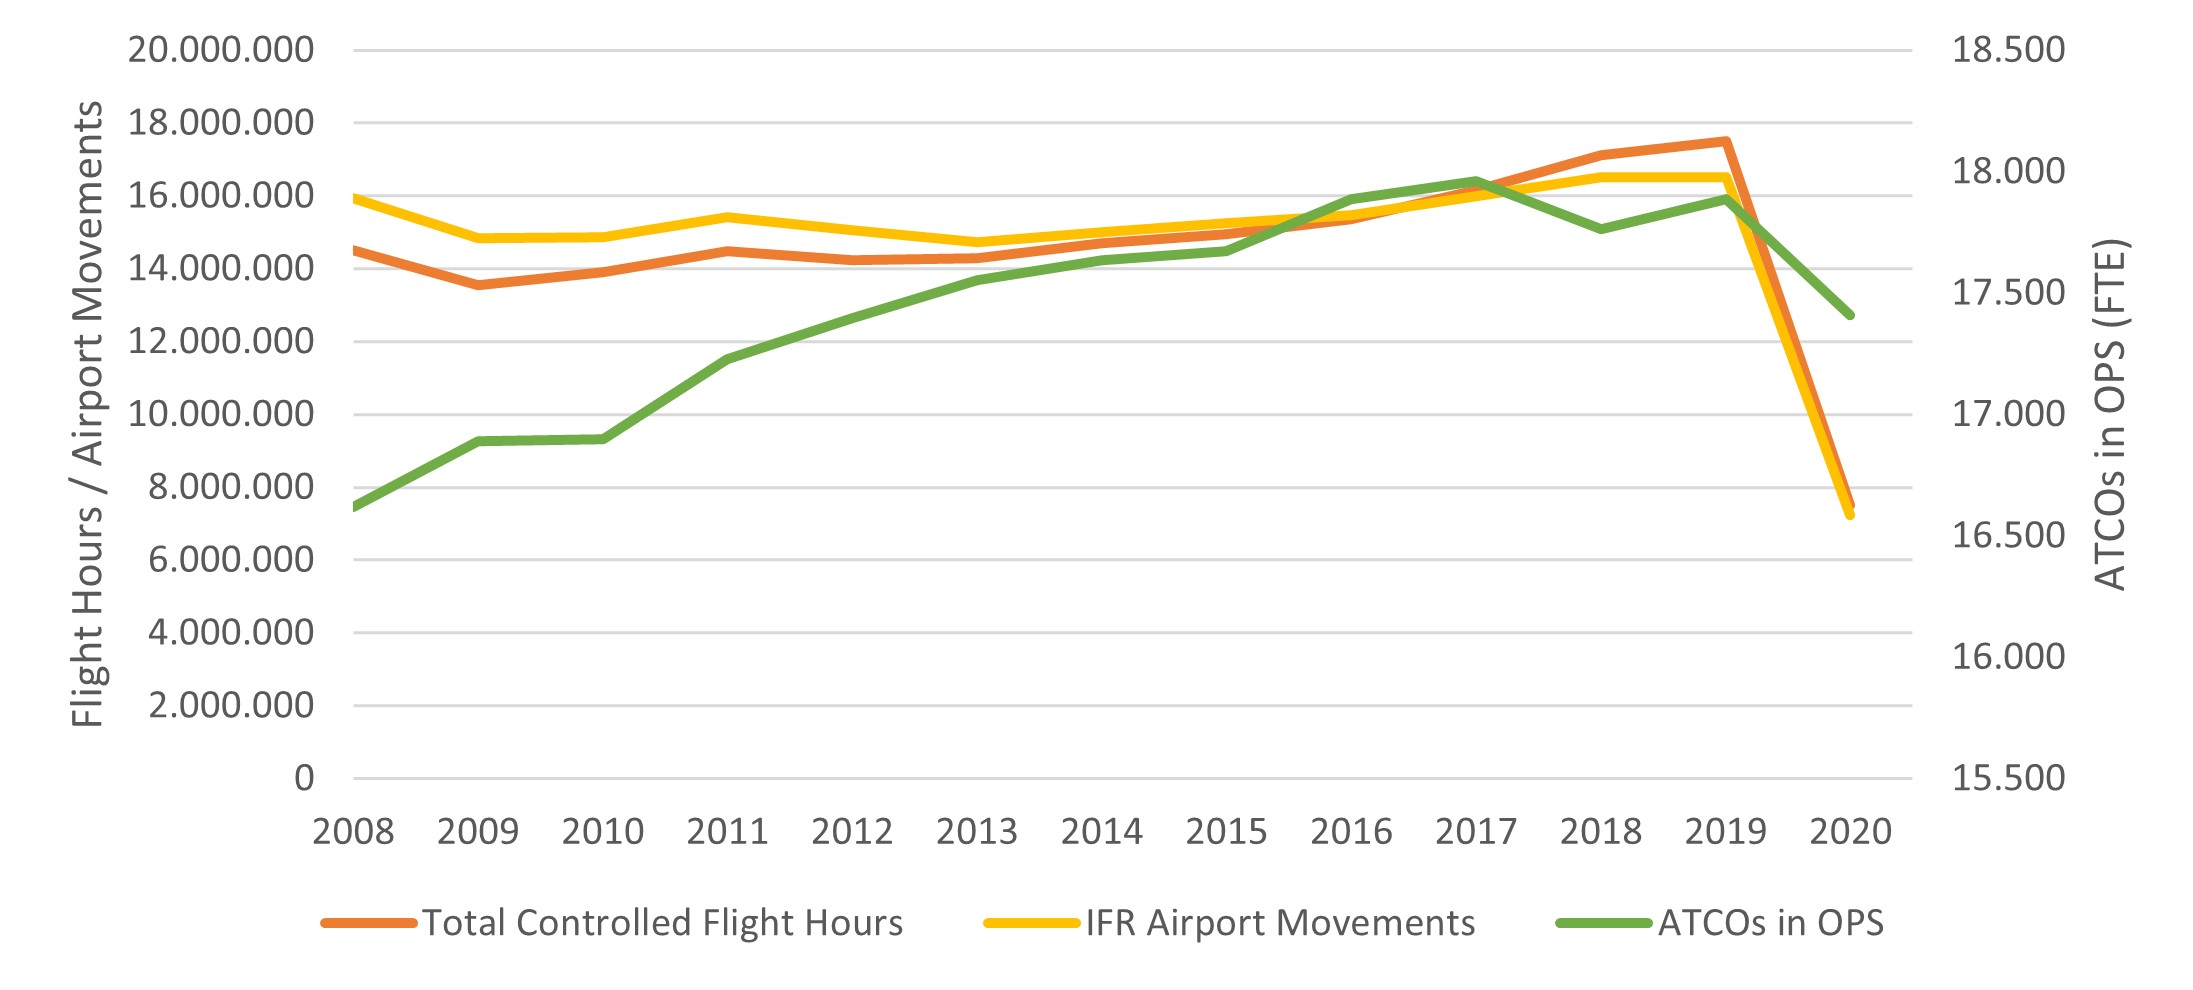
To provide an overview of the data and emphasize the pan-European
heterogeneity, Figure 3 illustrates the development of
several general indicators on the European level, while Table 1 presents ANSP-specific data for
comparison over time. The two output variables (yellow and orange line),
representing enroute10 and terminal11
services of ANSPs, show only smaller changes over time, yet there is a
slight increase from 2016 to 2019 before declining due to the impact of
COVID-19 in 2020. On the input side, the number of air traffic control
officers (ATCOs) measured in Full-Time Equivalences (FTEs) steadily
increases, with minor reductions observed in 2018 and 2020 (green line).
The figure also highlights the substantial differences in the response
times between changes in output and adjustments in resources. For
instance, the number of ATCOs decreased by 3% while the outputs
decreased by approximately 58%12.
Figure 3: Development of controlled flight hours, movements
on airports, and the employed ATCOs between 2008 and 2020.
It is important to note that data at the European level is averaged,
as it encompasses 38 observations, respectively 38 ANSPs. These units
vary significantly in terms of operational and geographic size, provided
services, socio-economic influences, and applied systems, as highlighted
in previous studies (FABEC 2019;
Standfuss et al. 2019; EUROCONTROL 2019a). As a result of this
heterogeneity, the data may be subject to some variations. Table 1 provides descriptive statistics for
both operational and financial data, representing the ’gate-to-gate’
perspective. Additionally, the table compares 2019 with 2008, enabling a
comprehensive analysis of the development over time. The last column
shows the change rate of the mean values in 2019 compared to 2008. The
data presented in the table highlight significant heterogeneity in both
operational and financial aspects of the European ATM network. In 2019,
the largest European airspace, managed by ENAIRE (Spain), was 107 times
larger than the smallest one, managed by Slovenia Control. These
differences in scale may strongly impact other indicators such as the
number of flights, flight hours, and flight distance: Considering
enroute operations, French DSNA ranks highest in all of the three listed
output indicators, while Moldatsa in Moldova13
has the lowest demand. Looking at terminal operations, German DFS leads
with 2.1 million IFR airport movements, which is about 100 times more
than the smallest unit, M-NAV of Macedonia14.
The analyses also shows that the size of the operational unit has an
impact on the required amount of resources, particularly on the number
of ATCOs. French DSNA employs the highest number of ATCOs, resulting in
the highest total number of ATCO hours. However, the average working
time per ATCO varies greatly, ranging from 960 hours for DFS to 2054
hours for NAV Portugal. Due to operational heterogeneity and wage
effects, total and average resource costs also differ significantly. For
instance, an ATCO hour in Germany is 15 times more expensive than in
Armenia. It is important to note that ATCOs are only a part of the human
resources, with more employees being involved in administration and
other aspects of ATM. The proportion of ATCOs to total staff ranges from
13% in Georgia to 56% in Ireland.
ATC services require not only skilled human resources, but also
infrastructure, including capital investments for building and
maintaining physical enroute or terminal control units. These resources
again vary significantly across different ANSPs, and differences can
often be attributed to their size. For instance, France and Spain have
the highest number of area control centers with five units each (2019),
whereas many smaller ANSPs operate only one ACC. Similarly, the number
of towers operated by ANSPs also varies significantly, with French DSNA
operating the highest number of towers at 75 (2019), followed by Turkey
with 51 towers. In comparison, DFS, which handles the largest number of
airport movements, operates only 16 towers, less than a quarter of the
number operated by DSNA. In addition to illustrating the significant
variation in values between ANSPs, the table also reveals changes over
time between 2008 and 2019, along with associated growth rates15. In particular, the number of air
traffic controllers has increased, employment costs per ATCO (real
terms) have risen, and working hours per year have decreased.
Nonetheless, the data shows that both ATCO productivity16
and cost effectiveness17 have improved over the years. This
suggests that the growth in output has outpaced the growth in resources,
leading to a more productive and cost-effective use of resources by
ANSPs.
Table 1: Descriptive Statistics 2008 and 2019
2008
2019
Change
Min
Mean
Max
St. Dev
Min
Mean
Max
St. Dev
Airspace size (km²)
18,400
362,540
2,190,000
427,785
20,500
346,400
2,190,000
423,175
-4,5%
No of ACC operational units
1
2
6
1
1
2
5
1
-6,7%
No of TWR operational units
0
12
79
15
0
11
75
14
-12.4%
IFR distance (M km)
0
231
1,505
314
8
330
1,810
401
43.3%
IFR flights controlled
41,020
761,056
2,935,173
739,649
55,299
884,556
3,302,045
793,472
16.2%
IFR Flight-hours controlled
10,426
402,645
2,291,924
506,038
12,716
460,429
2,483,703
562,095
14.4%
IFR airport movements
0
442,552
2,163,665
613,705
0
434,534
2,132,289
558,948
-1.8%
Composite flight hours
13,905
523,078
2,820,189
663,411
20,169
578,680
3,002,716
705,589
10.6%
ATCOs in OPS (FTE)
37
462
2,662
599
50
471
2,813
606
2.0%
Working Time per ATCO
1,145
1,528
2,336
235
960
1,441
2,054
222
-5.7%
Empl. Costs per ATCO (€)
14,629
127,379
385,714
79,602
23,976
141,367
313,888
72,336
11.0%
Total staff
122
1,598
8,734
1,951
164
1,518
7,622
1,839
-5.0%
Share ATCOs on HR
14.4%
28.9%
50.5%
9.4%
18.0%
31.8%
55.8%
9.8%
9.8%
Total costs (M €)
10
266
1,539
379
10
243
1,552
329
-8.8%
Total revenues (M €)
11
254
1,514
364
10
254
1,634
361
0.0%
ATM/CNS costs (M €)
6
180
976
251
5
178
1,091
241
-1.1%
ATCO productivity
0.17
0.78
1.86
0.30
0.21
0.90
2.23
0.34
15.3
Cost Effectiveness (€)
192.48
449.58
1490.99
215.01
164.85
394.74
843.53
149.01
-12.2%
While the data analysis highlights changes over time, it provides
limited insights into the factors that drive these changes, their
magnitude and the direction of influence on performance. A panel
analysis can offer significant added value in this regard. In the
following section, we present the results of a performance benchmarking
analysis conducted over several years. This analysis is divided into
three steps. The first step examines the trends in ATCO productivity and
cost effectiveness to provide a broad overview of the operational and
financial performance of ANSPs. In the second step, we use the models
developed by (Standfuss, Hirte, and Schultz 2022)
to calculate and compare DEA scores across ANSPs. Finally, in the third
step, we calculate the Malmquist indices. By conducting this
comprehensive analysis, we can better understand the drivers of
performance changes and identify areas for improvement to enhance the
operational and financial performance of ANSPs. The calculated values
represent input data, namely the dependent variables of the second-stage
regression analysis, which will be published in an upcoming paper.
5.2 ATCO productivity and
Cost-Effectiveness
EUROCONTROL initiated benchmarking of air navigation service
providers in the late 1990s, and since then, several metrics have been
developed to measure various aspects such as capacity, environmental
effects, and costs (EUROCONTROL 2021c). Two key
indicators that capture the trade-off between costs and capacity are
’ATCO productivity’ and ’cost-effectiveness’. In this section, we will
examine the historical trends of both indicators. This analysis will be
useful in interpreting the results of DEA as it considers both metrics
as absolute values that do not reflect the distance from an efficient
frontier.
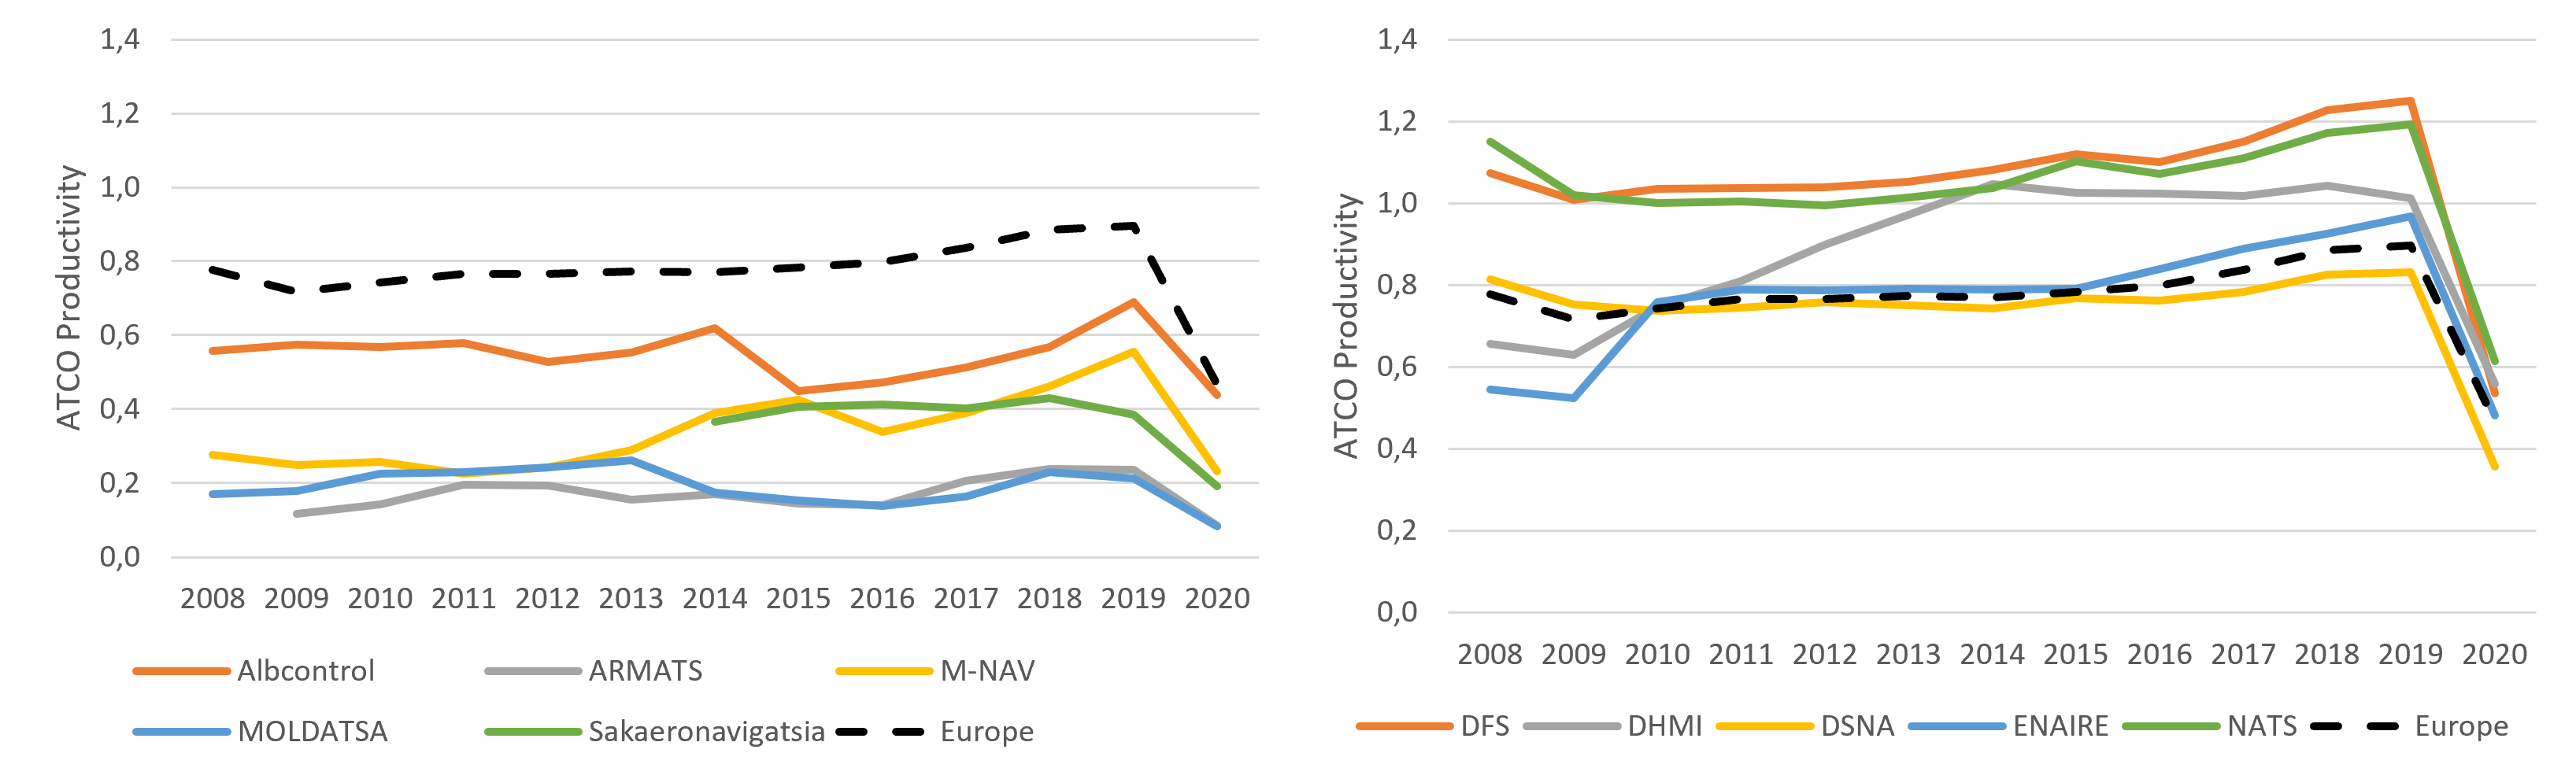
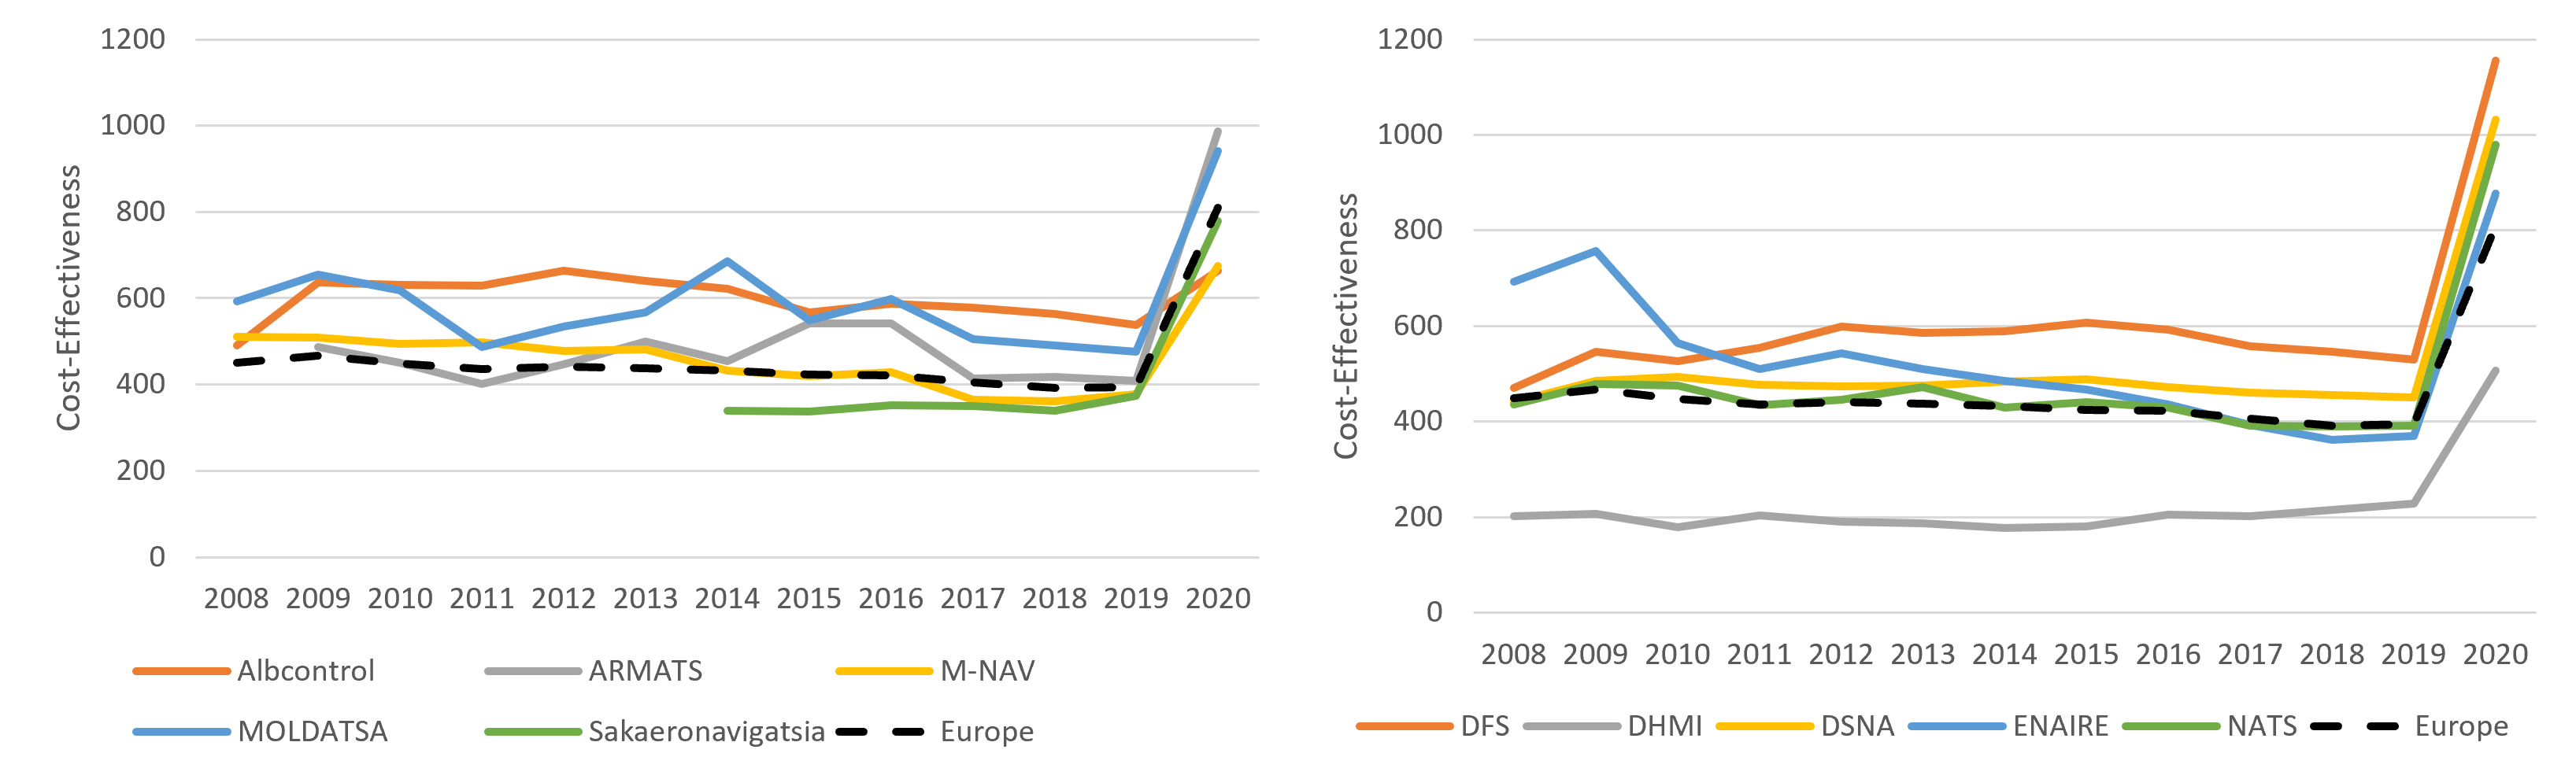
Figure 4 presents the ATCO-productivity, measured
in Composite Flight Hours (CFH) per ATCO hour, for the five largest and
smallest ANSPs, selected based on their total controlled IFR flight
hours in 2019. The pan-European average shows a slight increase in
productivity between 2009 and 2019, with a decline in 2020 due to the
COVID-19 pandemic. These findings align with those illustrated in
Figure 3. Nonetheless, as the average values
hide the high level of heterogeneity within Europe, there is
considerable variation in the ANSP-specific curves. Generally, the top
five ANSPs display higher productivity values than the five smallest
units, with a few exceptions. Productivity values of the large ANSPs are
mostly above the European average, while those of small ANSPs are
invariably below the European average. However, trends vary among the
different ANSPs. Small ANSPs exhibit high volatility in productivity
values, with significant shifts observed e.g. for MoldATSA and M-NAV.
These shifts are likely due to changes in air traffic patterns resulting
from the downing of MH17 and the associated closure of parts of
Ukrainian airspace, as well as Russia’s annexation of Crimea. Some large
ANSPs also show noticable productivity changes, especially German DFS
and British NATS, while French DSNA displays nearly constant scores.
Spanish ENAIRE and Turkish DHMI show some significant increases in
productivity. DHMI exhibits increased productivity between 2009 and 2014
due to growth in traffic and nearly constant ATCO hours, and stagnating
scores between 2014 and 2019 as CFH increased at a similar rate to ATCO
hours. ENAIRE experienced a tremendous increase in productivity between
2009 and 2010. Upon closer examination, it is evident that traffic
remained relatively constant, while ATCO hours decreased by 29%.
Figure 4: ATCO Productivity of five smallest and five
largest ANSPs compared to the pan-European average.
The financial indicator represents the operational costs18 per composite flight hour. In other
words, a higher value of this indicator implies higher costs and lower
performance in the airspace. Figure 5 illustrates that
almost all observations are above the pan-European average. This result
may be attributed to two factors. First, productivity is lower in
smaller ANSPs, as demonstrated in Figure 4. Second, many
larger ANSPs are located in countries with higher income levels,
affecting also ANSPs’ wage levels. This hypothesis is supported by the
example of Turkish DHMI, where wage levels are considerably lower than
in countries like Germany. In addition, the effects of the downing of
MH17 are partly similar, with the ANSP in Moldova becoming more less
cost effective in 2014. Furthermore, ENAIRE managed to increase
cost-effectiveness in 2010 by reducing ATCO-hours and subsequently
costs. With the exception of Armenian ARMATS and MoldATSA, all scores
remained nearly constant over time, excluding 2020.
Figure 5: Cost-effectiveness score of the five smallest and
five largest ANSPs compared to the pan-European average.
The observations on productivity and cost-effectiveness provide an
initial insight into the performance trends in Europe. However, the
measures have limitations: ANSPs use more resources than just ATCOs, and
the output measure of Composite Flight Hours has been subject to debate
(EUROCONTROL 2020a;
Standfuss, Fichert, and Schultz 2018). Therefore, using
multi-factorial analysis methods, such as DEA, leads to a more
comprehensive understanding. In this study, we will first apply
uniperiodic models before applying multiperiodic Malmquist analyses.
5.3 Technical Efficiency
The purpose of this section is to examine the trends in DEA
efficiency scores. We utilize both models and results of (Standfuss, Hirte, and
Schultz 2022). The authors found that standard DEA models were
effective, and that the use of specialized models, such as bootstrapped
or slack-based models, did not improve results. Additionally, their
study revealed that operational data is more suitable for modeling
purposes than financial data. They also identified Maastricht UAC as a
significant outlier due to the limited services provided, only covering
the upper airspace. However, we used submodels that include Maastricht
(A-models) as well as submodels without this ANSP (B-models) to
facilitate a comparison of the results. In light of these findings, we
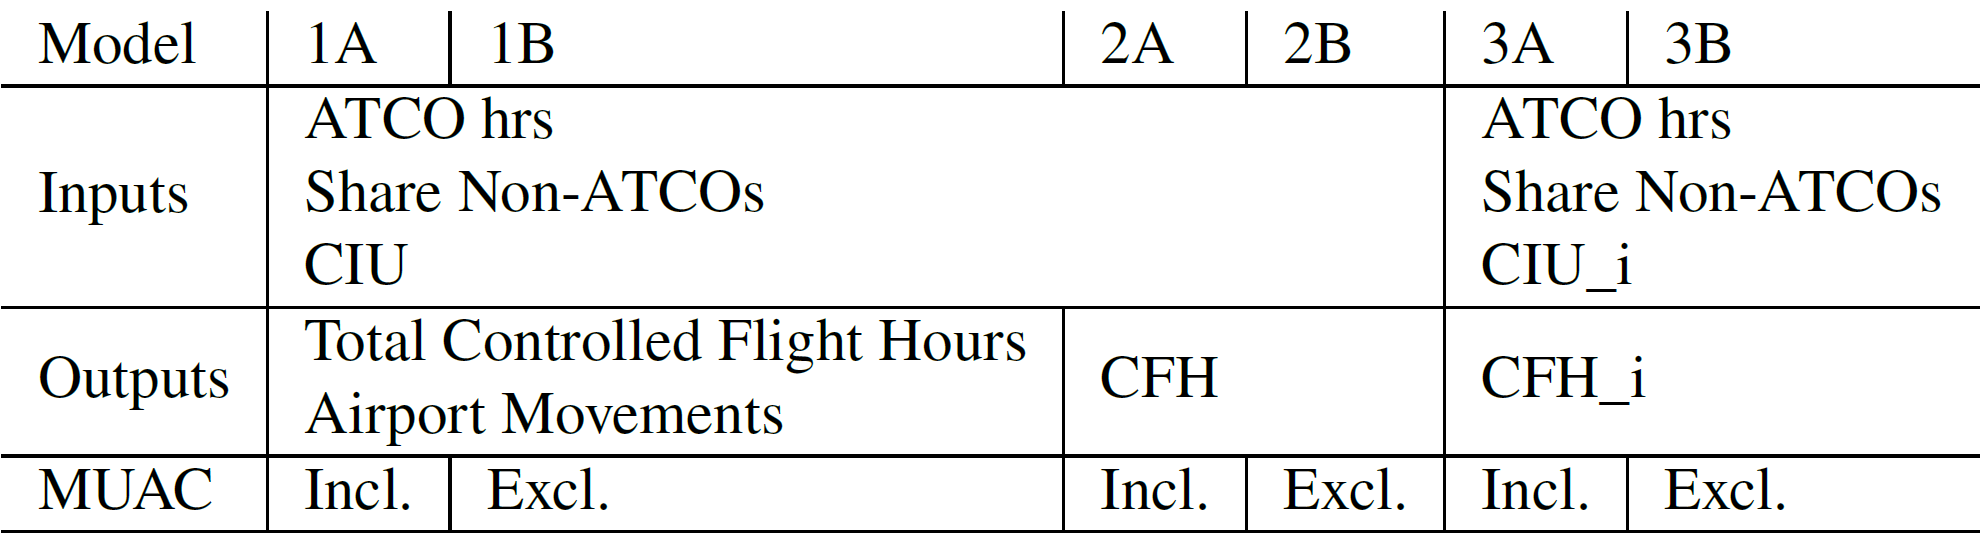
use the standard DEA approach and the models presented in Table [table:DEAMod] to calculate and
compare the efficiency scores. We utilize a composite input metric,
denoted as CIU, which takes into account the number of towers and ACCs,
following the logic of CFH. We weight this metric according to the
EUROCONTROL standard, as published in (EUROCONTROL 2020a), or by the
individual unit cost share of enroute cost to terminal cost, as
discussed in (Standfuss, Fichert, and Schultz
2018), indicated by the index i.
Table 2: Descriptive Statistics 2008 and 2019
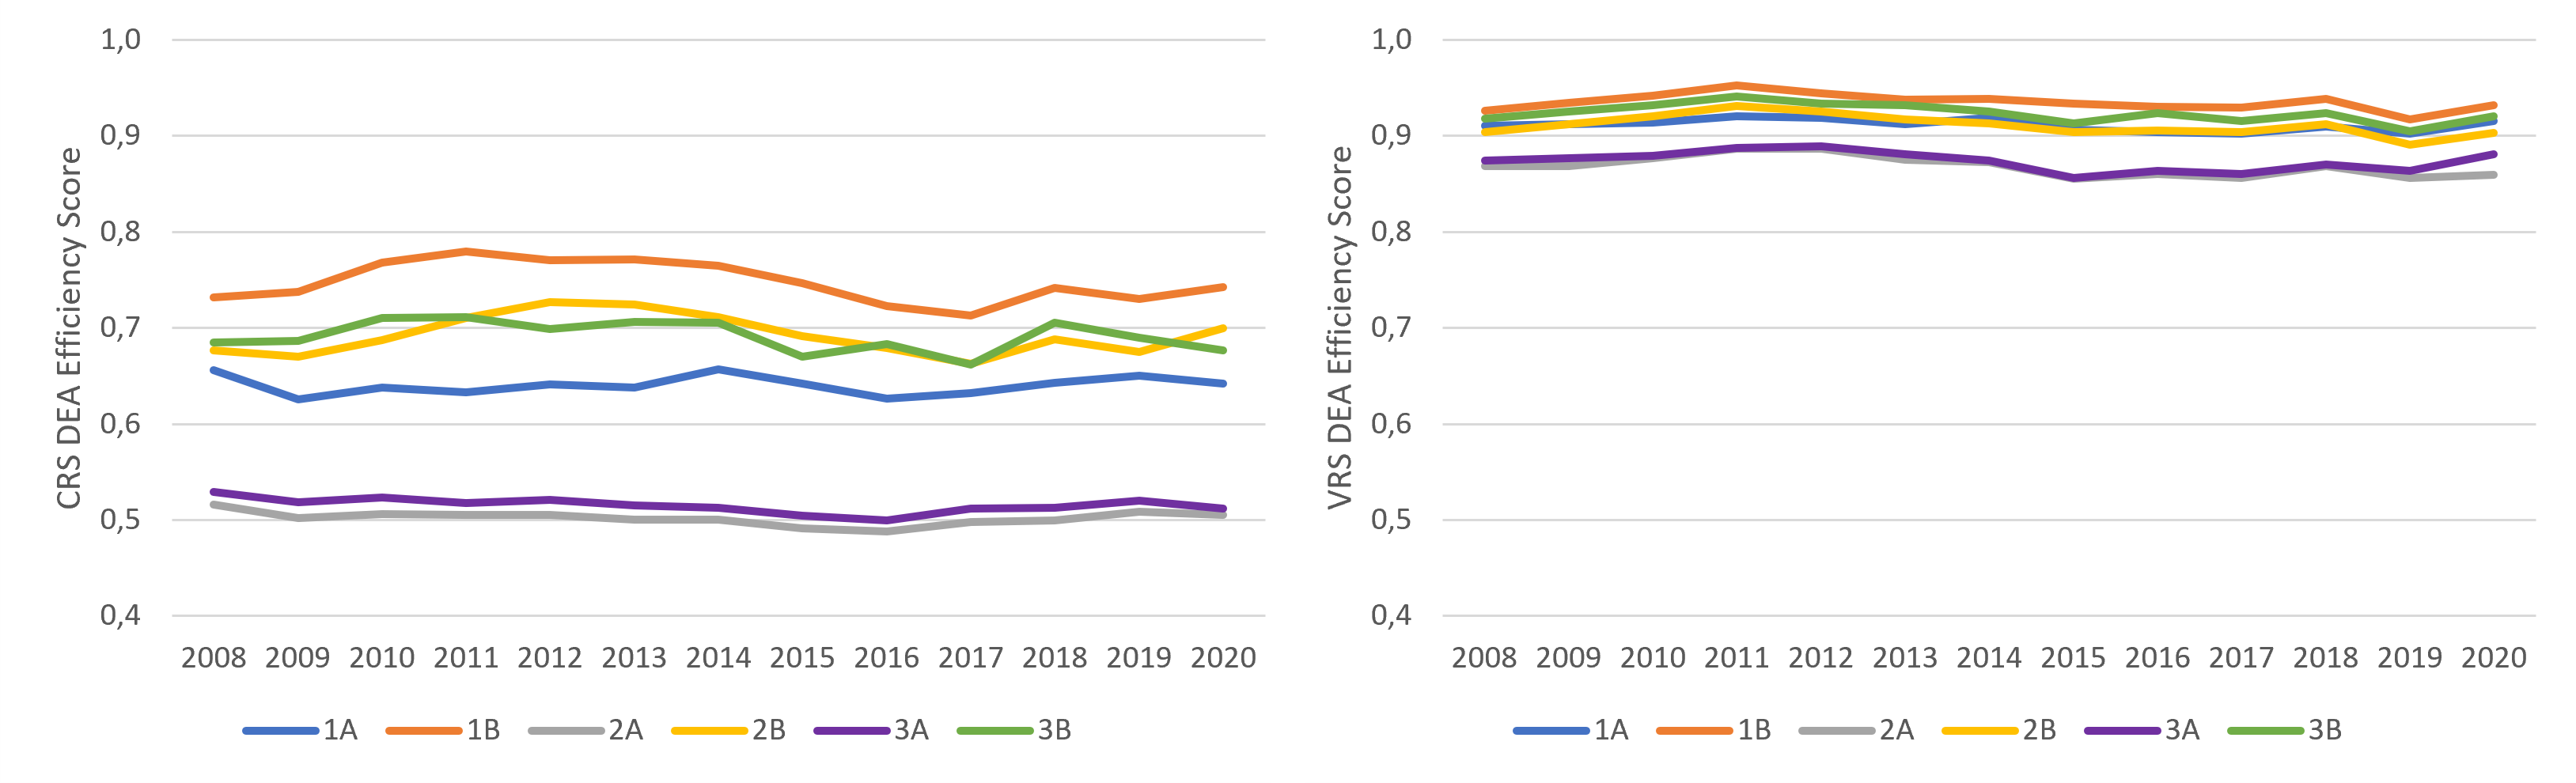
We conducted our analysis based on 2,878 observations, spanning 13
years, 38 ANSPs, and 6 models. Unfortunately, data for the Armenian and
Georgian ANSPs were not available for all years. To present our findings
clearly, we divided our discussion into two parts. First, we compared
the models using the pan-European mean, allowing for a more precise
comparison between them. Figure 6 presents the
results for technologies with constant and variable returns to scale. As
the graph demonstrates, the scores are relatively stable, indicating
that the average distance between the DMUs and the efficient frontier
represented by their peers is similar over time. Model 1B achieved the
highest efficiency scores, likely because we used five factors,
resulting in more DMUs being classified as efficient than in models with
only four factors. Additionally, excluding MUAC allowed ANSPs in the
MUAC peer group to achieve higher efficiency scores. This trend is
evident in all other models, as the B-versions consistently show higher
DEA scores than their A-variants. We also observed that these
differences diminish when implementing variable returns to scale.
Overall, the scores are higher, as assuming VRS leads to a convex
production function, attributing inefficiency differences to scale
rather than technical factors. Consequently, the distance between
inefficient units and the efficient frontier is lower.
Figure 6: DEA scores implying constant (left) and variable
(right) returns to scale. Values represent the pan-European
average.
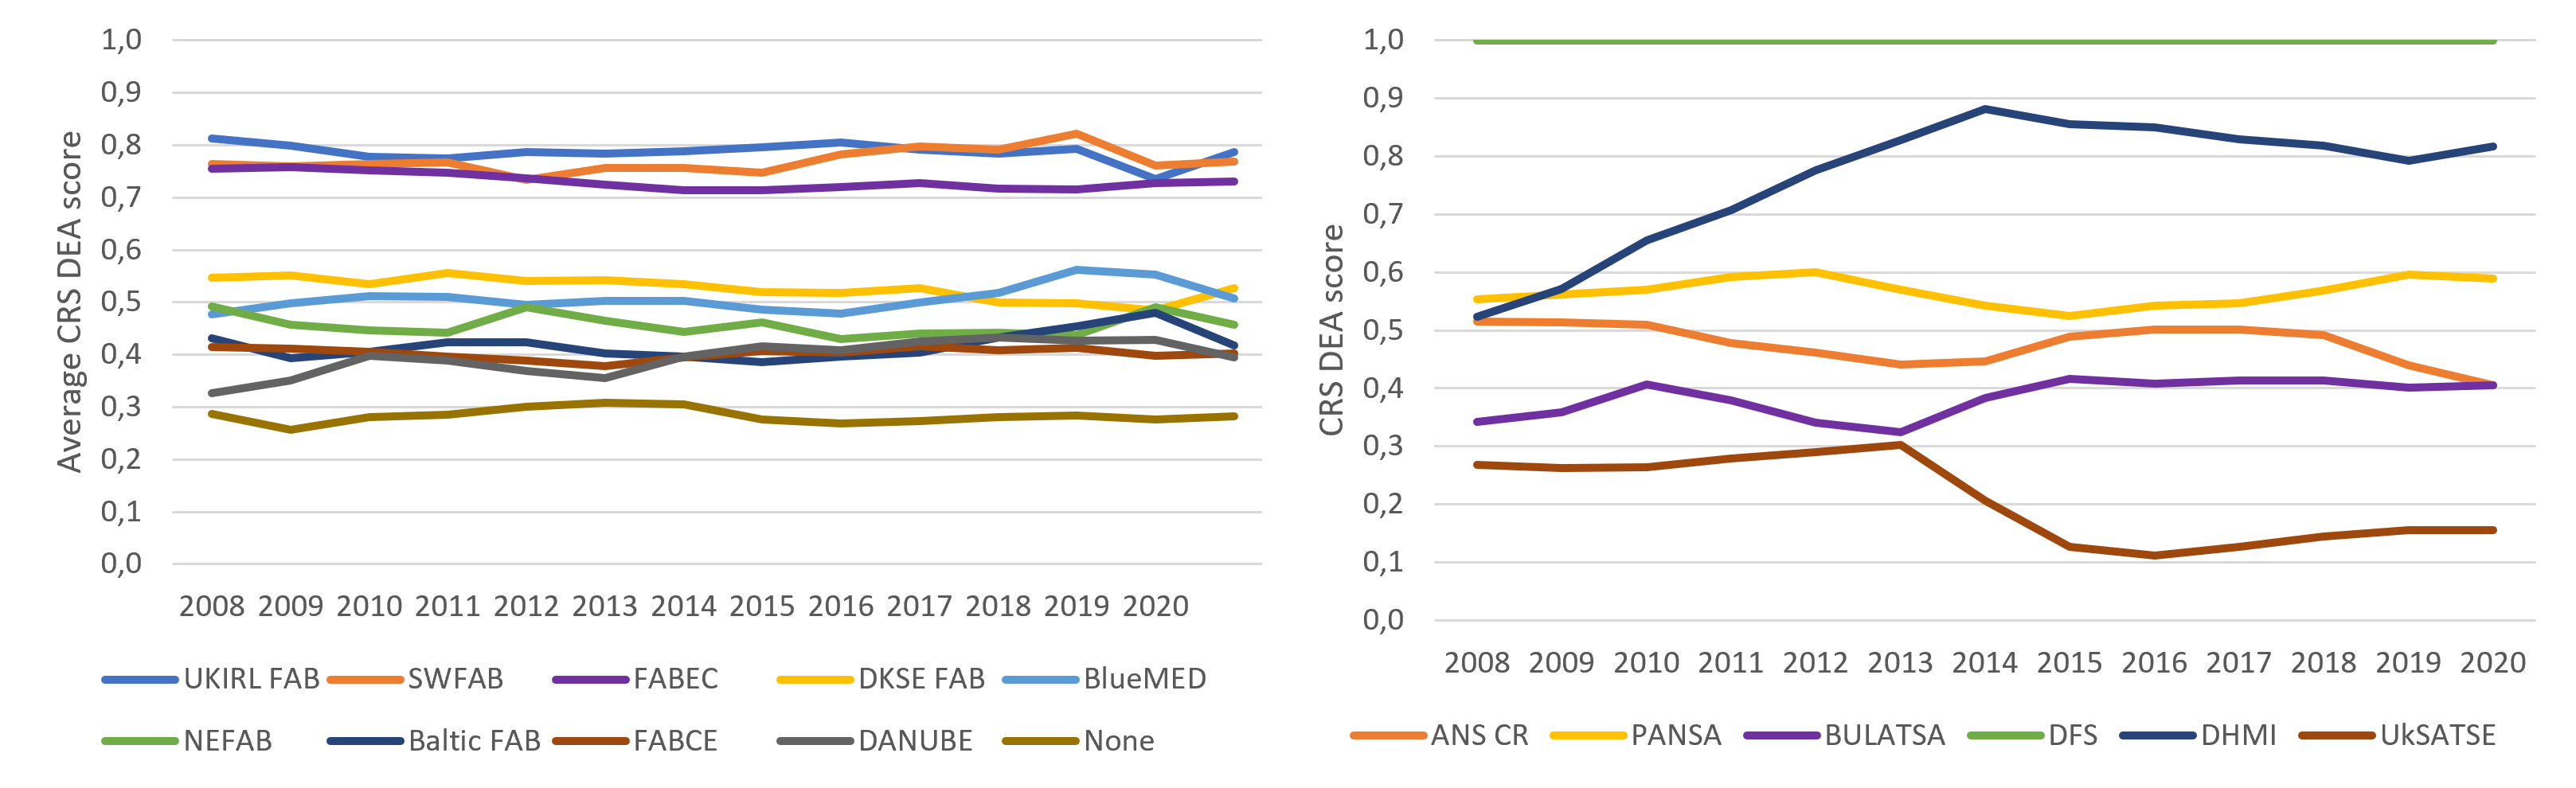
Next, we provide a more granular analysis of our results.
Specifically, we examine the average efficiency of the Functional
Airspace Blocks (FABs) and based on a selection of ANSPs. We chose to
use Model 2A for three reasons. Firstly, the models using five factors
(1A and 1B) identified more efficient units than the other models, which
would make the results less comparable. Secondly, the A-models included
MUAC, which could enhance the precision of the FAB analysis. Finally,
the differences between models 2 and 3 were negligible19.
Figure 7 displays the FAB results on the left
side20. Based on the results, it appears
that being associated with a FAB positively influences efficiency. The
FABs with the highest average efficiency are UKIRL, which includes NATS
and IAA, and SWFAB, which includes NAV Portugal and ENAIRE. However,
these FABs consist of only two ANSPs, making them more susceptible to
extreme values. On the other hand, FABEC ranked third and comprises six
highly diverse ANSPs (DFS, MUAC, skyguide, skeyes, LVNL, and DSNA)21, yet still manages high
efficiency.
On the right hand side of Figure 7, we present
results for some selected ANSPs of different operational sizes. For
example, German DFS achieves efficiency in every year we considered. As
seen in Figure 4, Turkish DHMI consistently improves
efficiency between 2014 and 2018. Further, the consequences of the
Russian annexation of Crimea and the downing of MH17 are evident when
comparing the efficiency trends, which are positive for the Bulgarian
service provider but negative for the Ukrainian ANSP.
Figure 7: DEA scores on FAB (left) and ANSP (right) level.
FAB values represent the unweighted average of the coresponding
ANSPs
Results exhibit high robustness, with the largest volatility observed
in DHMI and the Maltese provider, both due to the positive trend in
efficiency scores. Three ANSPs show no volatility at all, achieving
efficiency in all years considered: DFS, DSNA, and MUAC. Comparing the
results with Model 2B hardly changes the overall picture: The primary
difference is that efficiency scores are higher, as MUAC significantly
affects the efficient frontier.
5.4 Malmquist Index
To create a harmonized panel for the multiperiodic model, we
consolidated the data so that there is an equal number of observations
for each year. Therefore, we had to either reduce the number of ANSPs or
limit the number of years considered, as data for the Armenian and
Georgian ANSPs were incomplete. Since these units are outside of the
core area of Europe and EUROCONTROL, we chose to conduct the panel
analysis without them, but for all years under consideration. This
resulted in a total of 468 data points for A models and 455 data points
for B models. We computed Malmquist indices for each ANSP and for each
model across the selected period. To consolidate the data at the FAB and
European levels, we utilized the geometric mean. The year-over-year
change rates were determined by comparing each year’s data to the
preceding year’s. The initial year analyzed in our findings is 2019.
Additionally, we decomposed the indices into their constituent parts, as
outlined in Section 4.
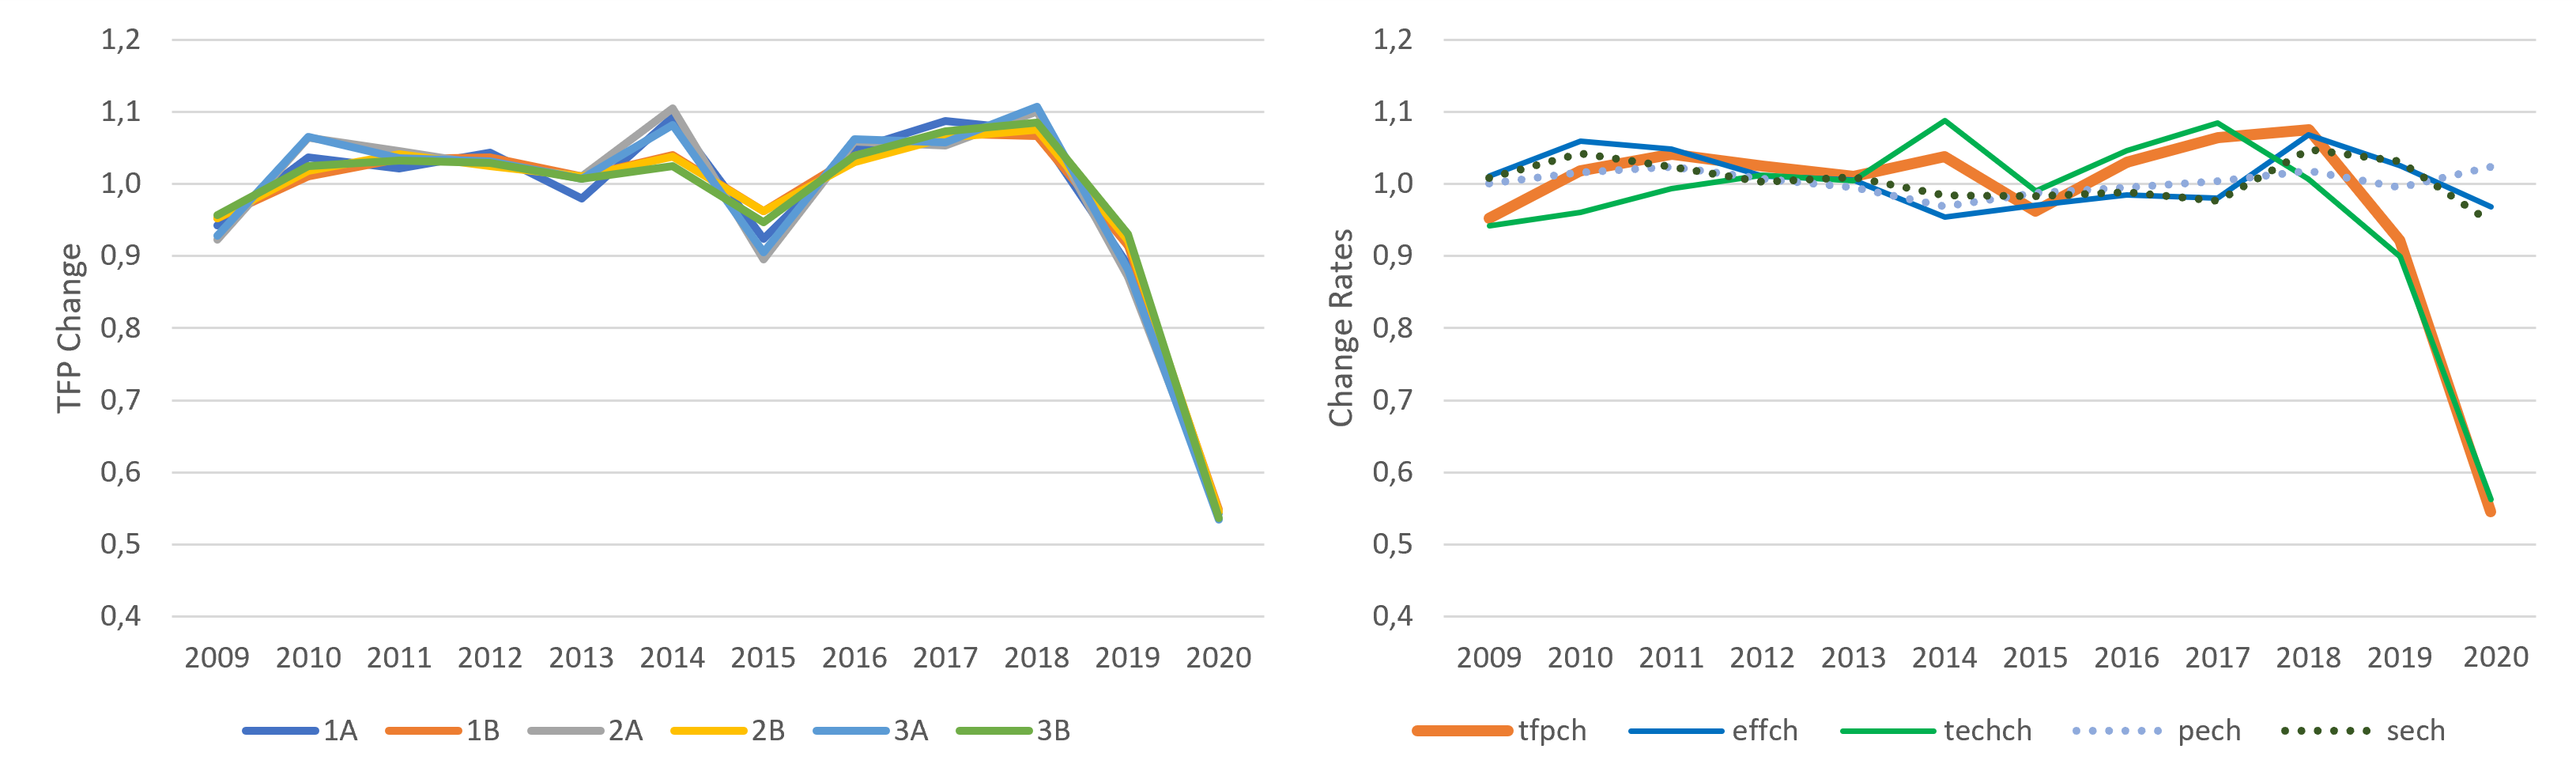
Figure 8 depicts two outcomes of the analysis. The
left-hand side provides an overview of the specific trends in the
different models. The graph indicates negligible deviations between the
models, with the B models exhibiting greater stability in 2014 and 2015.
Moreover, the COVID impact on TFP is noticeable, resulting in a
substantial shock and a corresponding decline in TFP. However, with the
exception of 2015, 2019, and 2020, all models and years22
demonstrate an increase in TFP. Please note that the period shown in
Figure 8 is different to previous illustrations in
this paper, as it starts in 2009 instead of 2008. This is due to the
fact that the Malmquist index represents a growth rate. Therefore, the
result for 2009 represents the growth in comparison to 2008. The
decomposition of the results of Model 2B is presented on the right-hand
side of the graph, where the bold solid orange line represents the TFP
change (tfpch), while the thin lines depict technical advance
(techch) and efficiency changes (effch), and the
dotted lines represent the sub-components of efficiency. Notably, it is
evident that the substantial decline in TFP is not attributed to
productivity changes (radial distance to the efficient frontier), but
rather due to the shift of the production function. Similarly, there is
only a minor change in pure (pech) and scale efficiency
(sech). This decomposition approach enables us to identify
drivers of downturns. For instance, the decrease in TFP in 2015 can be
attributed to a lower (average) efficiency score, while technical change
is increasing. This may indicate a traffic shift where peer units were
faced with higher demand, and/or there was a significantly lower demand
for non-peers.
Figure 8: Malmquist Index for different models (left) and
the decomposition of the results of Model 2B into components
(right)
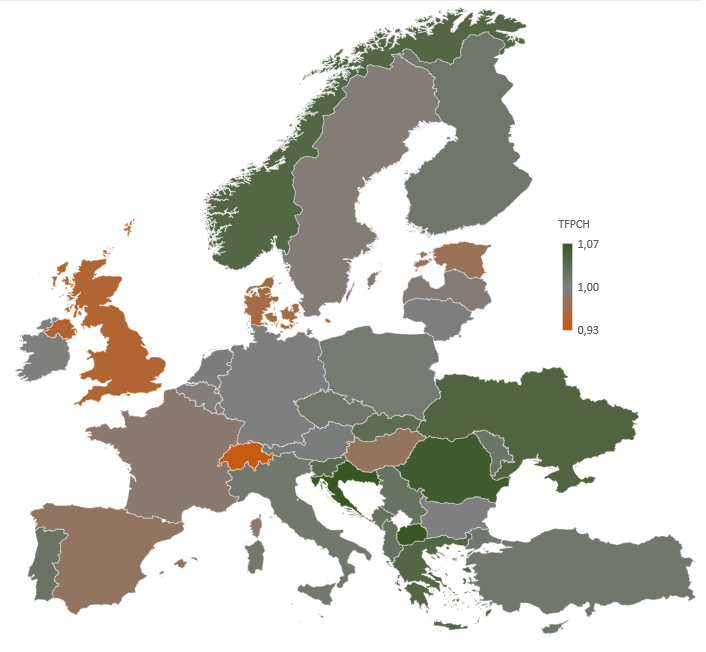
Examining Model 2B in more detail, we turn our attention to
ANSP-specific outcomes. Figure 9 illustrates
the change in TFP (geometric mean) between 2009 and 201923.
Brown-shaded countries show a decrease in performance, while
green-shaded countries indicate an increase in TFP. It is noteworthy
that most of the ANSPS locatd in southeastern and eastern parts of
Europe, including Ukraine, demonstrated a positive change in TFP, while
western ANSPs such as NATS, DSNA, and ENAIRE experienced a decline. The
ANSPs in grey-shaded countries found themselves in a stagnating
environment. Overall, 25 out of 35 ANSPs achieved a positive average
change in TFP. Figure 9 provides some additional insights;
however, as the values represent average data, annual values may differ
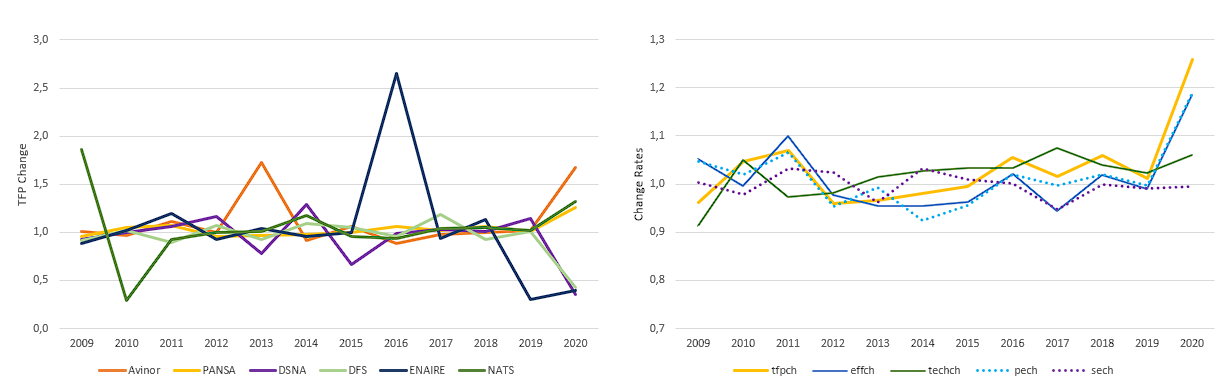
significantly. In consequence, Figure 10 displays on
the left-hand side the change rates in TFP for a selection of ANSPs.
Notably, the figures depict a more volatile image compared to
pan-European or periodic averages, particularly visible for Ukraine,
where the ANSP nearly tripled their TFP in 2019. However, extreme TFP
growth values are visible for multiple ANSPs, although the years differ
(e.g., ENAIRE 2016, NATS or ROMATSA in 2011). Conversely, there are also
observations where TFP decreases disproportionately, such as NATS 2010
and ENAIRE 2019. Observing the COVID year 2020, the highest TFP decline
was observed for Ukrainian UkSATSE and French DSNA, at about -65%.
Despite the significant influence of COVID, we calculated TFP growth for
four ANSPs: NATS, PANSA, skyguide, and Avinor, with the latter showing
the highest value (+68%).
Figure 9: Geometric mean of change in TFP between 2009 and
2019, Model 2B
On the right-hand side of Figure 10, we
demonstrate the decomposed indices for the Polish service provider,
PANSA, using Model 2B. Evidently, PANSA is one of four ANSPs to achieve
a positive change in TFP. The curves indicate that this was primarily
due to changes in efficiency, rather than a shift in the production
frontier. Since capital (ACCs / TWRs) cannot be adjusted in the short
term, the increase in efficiency is likely due to a relatively smaller
decline in demand or an over-proportional decrease in ATCO-hours, or
both. Upon analyzing the raw data, we found that PANSA experienced a
similar decrease in demand (about 57%) as DFS and DSNA. However, unlike
DFS, which increased its ATCO hours, PANSA reduced this input by 12%. A
similar trend was observed for Avinor, which had the lowest pan-European
decrease in traffic (39%), but also reduced ATCO hours by 26%.
Consequently, as shown in the figure, Avinor had an even higher increase
in TFP than Polish PANSA. Furthermore, the graph shows that there was no
significant change in scale efficiency, implying that PANSA managed to
use resources more efficiently than other units. Please note that
different scales are used for the graphs to show the changes more
clearly.
Figure 10: Malmquist Index for Model 2B for different ANSPs
(left) and the decomposition of the results for PANSA into components
(right)
6 Conclusion and Way Forward
Evaluating performance in ATM remains an area of great managerial and
political interest. Due to the monopolistic position of ANSPs and the
complex environment, a comprehensive understanding of the factors that
positively or negatively impact performance is still lacking. This study
addresses part of this scientific gap by examining changes in predefined
performance indicators over time. The primary determinant of an entity’s
performance is how effectively it can convert available resources into a
pre-set output. We derived further that performance is also related to
the size of an ANSP. Larger ANSPs may have higher fixed costs due to
their investments in multiple ACCs and towers, while smaller ANSPs may
have rather limited capabilities due to limited resources.
In this study, we employ three main approaches. Firstly, we use
simple index figures developed by EUROCONTROL to reflect operational and
financial performance. These figures are easy to interpret, but have the
disadvantage of being difficult to compare in heterogeneous
environments. Secondly, we use Data Envelopment Analysis (DEA),
distinguishing between six economic models. This method enables us to
decompose efficiency values into technical and scalar components.
However, as production and cost functions may change over time, time
effects should be considered. Therefore, thirdly, we apply a Malmquist
analysis to capture technical progress in addition to scalar and
technical components extracted from efficiency changes. As assumed in
the introduction, local and global shocks are clearly identifiable
within the analyses. For instance, a rapid decline in TFPCH due to
COVID-19 is apparent. Additionally, several local effects caused by the
downing of MH17 and the annexation of Crimea by Russia, as well as the
resulting diversion in traffic, can be observed. Except for a few units,
TFP in Eastern and Northern Europe tends to increase on average while it
decreases in Western Europe. One possible explanation could be the
establishment of Eastern European low-cost carriers such as Wizzair or
increasing demand for flights into the middle east.
The study offers an initial glimpse into the development of
efficiency at different levels of aggregation. However, it should be
viewed as a first step. To gain a comprehensive understanding of the
factors that contribute to (in-)efficiency, a thorough root cause
analysis is necessary. This approach provides a more holistic and
in-depth assessment of the factors that impact efficiency in ATM.
Therefore, in a subsequent study, we will use the Malmquist Index to
identify and quantify the key influencing factors. TFPCH values will
serve as dependent variables in regression models that consider both
time and unit-specific effects. The independent variables encompass both
potential endogenous and exogenous influencing factors, such as traffic
characteristics, environmental influences, and legal aspects. This
holistic approach ensures that not only a single effect is highlighted,
but also interdependencies between multiple factors are taken into
account. This approach thus enables the derivation of specific
managerial recommendations to enhance performance and promote the
creation of a more resilient system in a volatile environment.
The authors aim to update the study as soon as new data is provided
by EUROCONTROL’s Performance Review Unit. This allows for a more
detailed analysis of the effects of COVID-19 on efficiency at both
global and local levels. By incorporating up-to-date data, the study can
capture the dynamic changes in the aviation industry due to the
pandemic, and provide valuable insights into the impacts on operational
performance and efficiency. Additionally, the authors suggest the
possibility of conducting an analysis at more granular levels, such as
ACC or sector level, although the inclusion of sectors as a Decision
Making Unit (DMU) may be debatable. Nevertheless, this approach can
offer insights into specific regions or sectors within the aviation
system, which can further enrich the benchmarking scheme and contribute
to a more accurate root cause analysis.
Furthermore, the authors suggest to include the ANSP of the United
States in the benchmarking scheme, which allows for a meaningful
comparison between the U.S. and Europe. This helps to address the
debates and criticisms regarding performance comparisons between these
two regions, and provide a more comprehensive and balanced assessment.
In general, the authors emphasize the potential value of extending the
benchmarking approach to other regions, as it can contribute to a more
robust and accurate analysis. By incorporating additional regions, the
root cause analysis and resulting implications can be further enhanced,
providing a more comprehensive understanding of the factors influencing
performance. However, in order to include more regions, stakeholders
first would have to agree on a standardized way of collecting and
reporting data.
References
Adler, Nicole, Eran Hanany, and Stef Proost. 2022. “Competition in
Congested Service Networks with Application to Air Traffic Control
Provision in Europe.”Management Science 68 (4):
2751–84.
Andribet, Pierre, Marc Baumgartner, and Jean-Marc Garot. 2022.
“Reinventing European Air Traffic Control Based on the Covid-19
Pandemic Experience.”Utilities Policy 75.
Arnaldo, Rosa M., V. Fernando Gómez Comendador, Rocio Barrangan, and
Luis Pérez. 2014. European Air Navigation Service Providers’
Efficiency Evaluation Through Data Envelopment Analysis (DEA). St.
Petersburg: International Council of Aeronautical Sciences Conference
(ICAS).
Banker, Rajiv D., and Ram Natarajan. 2008. “Evaluating Contextual
Variables Affecting Productivity Using Data Envelopment
Analysis.”Operations Research 56: 48–58.
Bilotkach, Volodymyr, Simone Gitto, Radosav Jovanović, Juergen Mueller,
and Eric Pels. 2015. “Cost-Efficiency Benchmarking of European Air
Navigation Service Providers.”Transportation Research Part
A: Policy and Practice 77: 50–60.
Birkmeier, Bettina, and Bernd Korn. 2014. Five Transition Strategies
for Sectorless ATM. Colorado Springs: Digital Avionics Systems
Conference (DASC).
Blondiau, Thomas, Eef Delhaye, Nicole Adler, and Stef Proost. 2016.
Productivity Measurement of Air Traffic Management in Europe.
COMPAIR Project.
Bogetoft, Peter, and Lars Otto. 2011. Benchmarking with DEA, SFA,
and r. New York: Springer Science & Business Media.
Bugayko, Dmytro, Olga Shevchenko, Nadiia Perederii, Natalia Sokolova,
Mykhaylo Podrieza, and Danylo Bugayko. 2023. “Proactive Risk
Management of Ukrainian Aviation Transport Post-War Recovery and
Sustainable Development.”Electronic Scientific and Practical
Journal 18.
Button, Kenneth, and Rui Neiva. 2013. “Single
European Sky and the functional airspace blocks: Will they improve
economic efficiency?”Journal of Air Transport
Management 33: 73–80.
Buyle, Sven. 2022. “Is Privatization of ATC an Economic Game
Changer? Who Gains and Who Loses?”The Air Transportation
Industry : Economic Conflict and Competition, 335–60.
Cantner, Uwe, Jens Krüger, and Horst Hanusch. 2007. Produktivitäts-
Und Effizienzanalyse - Der Nicht Parametrische Ansatz. Berlin:
Springer Verlag; Springer-Verlag.
Charnes, A., W. W. Cooper, and E. Rhodes. 1978. “Measuring the
Efficiency of Decision Making Units.”European Journal of
Operational Research 2 (5): 429–44.
Coelli, Tim J., Prasada D. S. Rao, Christopher J. O’Donnell, and George
E. Battese. 2005. An Introduction to Efficiency and Productivity
Analysis. New York: Springer.
EUROCONTROL. 2019a. Air Traffic Management Cost-Effectiveness (ACE)
Benchmarking Report for 2017. Brussels: Performance Review Unit.
———. 2019b. Performance Review Report - an Assessment of Air Traffic
Management in Europe During the Calendar Year 2018. Brussels:
Performance Review Commission.
———. 2020b. NEST User Guide. Brussels / Paris: Ch. 6.6.
———. 2020c. Performance Review Report of the European Air Traffic
Management System in 2019. Brussels: Performance Review Commission.
———. 2021a. ATM Cost-Effectiveness (ACE) 2019 Benchmarking Report
with Special Focus on COVID-19 Impacts in 2020. Brussels:
Performance Review Unit, ACE Working Group.
———. 2021b. Horizontal En-Route Flight Efficiency Dataset.
Single European Sky Portal: https://ansperformance.eu/ (10.05.2021).
———. 2021c. SES Performance Scheme Reference Period 3
(2020-2024). Single European Sky Portal:
https://www.eurocontrol.int/prudata/dashboard/metadata/rp3/
(10.05.2021).
———. 2022. OneSky Online Data Portal. Brussels: ACE Working
Group.
———. 2023a. Airport Arrival Air Traffic Flow Management (ATFM)
Delays. Brussels: Performance Review Unit.
EUROCONTROL, and FAA. 2016. Comparison of Air Traffic
Management-Related 2015 Operational Performance: U.s./Europe.
———. 2019a. U.s. - Europe Comparison of ATM Related Operational
Performance 2017. Brussels.
———. 2019b. U.s. - Europe Continental Comparison of ANS
Cost-Efficiency Trends 2006-2016. Brussels: Performance Review
Unit.
———. 2021. Special Report on the Impact of the COVID-19 Pandemic on
the u.s. And European ANS Systems. Brussels.
European Commission. 2013. “Commission Implementing Regulation
(EU) No 390/2013 of 3 May 2013 Laying down a Performance Scheme for Air
Navigation Services and Network Functions.”Official Journal
of the European Union 128: 1–30.
FABEC. 2018. Volatility Task Force - Final Report. Langen:
Performance Management Group, Volatility Task Force.
———. 2019. ACC Capacity Benchmarking Report - an Analysis of
Difference in Capacity and Operational Practices Applied Across Selected
FABEC ACCs. Langen: FABEC Performance Management Group.
———. 2021b. “Forecasting European Air Traffic Demand - How
Deviations in Traffic Affect ANS Performance.”Study for
Inter FAB. Contributors: Thomas Standfuss and Matthias Whittome.
Färe, R, S. Grosskopf, M. Norris, and Zhang Z. 1994. “Productivity
Growth, Technical Progress and Efficiency Changes in Industrialised
Countries.”American Economic Review 84: 66–83.
Fried, Harold O., C. A. Knox Lovell, and Shelton S. Schmidt. 2008.
The Measurement of Productive Efficiency and Productivity
Growth. Oxford: Oxford Univerity Press.
Gerdes, Ingrid, Annette Temme, and Michael Schultz. 2018. “Dynamic
Airspace Sectorisation for Flight-Centric Operations.”Transportation Research Part C: Emerging Technologies 95:
460–80.
Hoff, Ayoe. 2007. “Second Stage DEA: Comparison of
Approaches for Modelling the DEA Score.”European Journal of
Operational Research 181: 425–35.
Lechner, Peter, Andrew Tupper, Marianne Guffanti, Sue Loughlin, and Tom
Casadevall. 2017. “Volcanic Ash and Aviation — the Challenges of
Real-Time, Global Communication of a Natural Hazard.”Advances in Volcanology.
Linden, Erik. 2021. “Pandemics and Environmental Shocks: What
Aviation Managers Should Learn from COVID-19 for Long-Term
Planning.”Journal of Air Transport Management 90.
NERA. 2006. Cost Benchmarking of Air Navigation Service Providers: A
Stochastic Frontier Analysis. London.
Névir, Marie-Christine. 2022. Entwicklung Und Validierung Eines
Workloadmodells Für Flight Centric ATC Unter Einbeziehung Der
Veränderung Der Lotsentasks Und Betrachtung Der Einflussgrößen
Teilautomatisierung Und Clustering. Dresden: Master Thesis, TU
Dresden.
Nova, Juan Espinar. 2022. NEST Analysis of European Flight Patterns
Before and After the 2014 Ukraine Conflict. Langen: Deutsche
Flugsicherung GmbH.
Ölçen, Olcay, and Serdar Alnipak. 2023. “A Profitability Analysis
of Air Navigation Service Providers in European Zone: COVID-19
Crisis.”Journal of Aviation 7: 110–22.
Pearce, Brian. 2012. “The State of Air Transport Markets and the
Airline Industry After the Great Recession.”Journal of Air
Transport Management 21.
Prakasa, Satria Unggul Wicaksana, Asri Wijayanti, Achmad Hariri, and
Levina Yustitianingtyas. 2022. The Effect of Russia–Ukraine War on
International Aviation Sectors. Melang: 3rd International
Conference on Law Reform (INCLAR).
Reichardt, Uta, Gudmundur F. Ulfarsson, and Guðrún Pétursdóttir. 2021.
“Developing Scenarios to Explore Impacts and Weaknesses in
Aviation Response Exercises for Volcanic Ash Eruptions in
Europe.”Journal of Air Transport Management 79: 5–12.
Rezo, Zvonimir, Sanja Steiner, Tomislav Mihetec, and Olja Čokorilo.
2023. “Strategic Planning and Development of Air Traffic
Management System in Europe: A Capacity-Based Review.”Transportation Research Procedia 69: 5–12.
Rezo, Zvonimir, Sanja Steiner, and Cristiana Piccioni. 2020. The
Genesis of Cost-Efficiency Based European Airspace Fragmentation.
Portoroz: 19th International Conference on Transport Science (ICTS).
Simar, Leopold, and Paul W. Wilson. 2007. “Estimation and
Inference in Two-Stage, Semi-Parametric Models of Production
Processes.”Journal of Econometrics 136: 31–64.
Spaho, Alma. 2015. Determinants of Banks’ Efficiency in Albania -
Data Envelopment Analysis and Tobit Regression Analysis. Istanbul:
International Conference on Social Sciences (ICOSS).
Standfuss, Thomas. 2021. “Performance Benchmarking in Air Traffic
Management - Methodology, Analysis, and Evaluation.” PhD-Thesis,
Dresden: Technische Universität Dresden.
Standfuss, Thomas, Frank Fichert, and Michael Schultz. 2017. Air
Traffic Management Performance Benchmarking - a Disaggregated
Approach. Tokyo: ENRI International Workshop on ATM/CNS (EIWAC).
———. 2018. Input and Output Measurement in Air Navigation Service
Provider Performance Benchmarking - Implementing Composite Indicators
for Efficiency Analysis Using European Data. Seoul: Air Transport
Research Society Conference (ATRS).
Standfuss, Thomas, Frank Fichert, Michael Schultz, and Petros Stratis.
2019. “Efficiency Losses Through Fragmentation? Scale Effects in
European ANS Provision.”Competition and Regulation in
Network Industries 20 (4): 275–89.
Standfuss, Thomas, Georg Hirte, and Michael Schultz. 2022. How to
Benchmark Air Navigation Service Providers? Toulouse: International
Transportation Economics Association Conference (ITEA).
Standfuss, Thomas, and Matthias Whittome. 2019. Benchmarking EU / US
– Operational Heterogeneities, Update 2019. ASB Information Paper.
Langen: FABEC Performance Management Group.
Starita, Stefano, Arne K. Strauss, Radosav Jovanovic, Nikola Ivanow, and
Frank Fichert. 2021. Strategic Cross-Border Capacity Planning Under
Uncertainty. 11th SESAR Innovation Days.
Sun, Xiaoqian, Sebastian Wandelt, and Anming Zhang. 2021.
“Technological and Educational Challenges Towards
Pandemic-Resilient Aviation.”Transport Policy 114:
104–15.
Tone, Kaoru. 2001. “A Slacks-Based Measure of Efficiency in ata envelopment analysis.”European
Journal of Operational Research 130: 498–502.
Verbeek, Marno. 2017. A Guide to Modern Econometrics. John
Wiley & Sons.
Whittome, Matthias, and Thomas Standfuss. 2018. Infrastructure
Financing of European Airspaces - Computation of US Passenger Taxes on
Europe. Studie für die Inter-FAB Performance Initiative: Langen.
Zhu, Joe. 2014. Quantitative Models for Performance Evaluation and
Benchmarking. New York: Springer.