Solving the mystery of discrepancies and double counting in air cargo through demand and supply big data analysis
Vincent Van Bockstaele[1], Sven Buyle[1] and Wouter Dewulf[1] [1]Department of Transport and Regional Economics, University of
Antwerp, 2000 Antwerp, Belgium
Abstract: This paper estimates and analyses the air cargo
demand and supply imbalances between large geographical regions based on
newly collected demand and supply data. Due to the need for more data
for academics and the industry, and the lesser research interest
compared to its passenger counterpart, limited empirical research on air
cargo market dynamics has been conducted. Live flight and aircraft data
were collected for five consecutive years to reconstruct the air cargo
network and capacity. Air cargo sales tonnes data were collected and
introduced as these data eliminate double counting of transfer route
volumes. Both datasets were used and compared to analyse the air cargo
trade imbalances. The major findings indicate an imbalance in demand on
most of the 110 studied region pair combinations. The supply data
indicate a high imbalance for freighter capacity, a relatively smaller
imbalance for integrator capacity and a limited imbalance for the
wide-body belly capacity. The data indicate that the Middle East,
Northeast Asia, Russia, Central Asia, and Central America regions are
all transfer or in-transit regions where a large amount of cargo passes
through. However, limited cargo volumes originate or find their final
destination here. Although the general assumption indicates that air
cargo supply follows air cargo demand, imbalances between demand and
supply in opposing directions were found for several region pairs. To
the best of our knowledge, this paper is one of the first academic
sources to introduce data analysis based on sales tonnes. This research
assists academics and the industry in getting a better understanding of
the current air cargo market dynamics. It also provides a base to
enhance future air cargo market research, analysis and forecasting.
Keywords:Air cargo demand and supply imbalances;Sales tonnes demand data;Air cargo market analysis Citation:Van Bockstaele, V., Buyle, S., and Dewulf, W. (2023). Solving the mystery of discrepancies and double counting in air cargo through demand and supply big data analysis. Journal of the Air Transport Research Society 1(1): 81-100 DOI:https://dx.doi.org/10.59521/6A961EF46EB809C5 Download:PDF
1 Introduction
With 60.9 million tonnes of goods transported in 2021, less than 1%
of world tonnes are estimated to be carried by air cargo. Because of the
high value of these goods, they represent about 35% of the value of
goods shipped globally (Boeing, 2022). The increase in air cargo rates
to record-breaking levels attracted much interest from inside and
outside the industry. Other than the bi-directional nature of air
passenger flows, air cargo tends to move from manufacturing to
distribution centres or from production to consumption centres causing
imbalances in air cargo flows (Zhang and Zhang, 2002). Those imbalances
are especially important for the planning departments of airlines
operating freighter aircraft as those aircraft often perform triangular
or multisector routes to cope with those imbalances (Bombelli et al.,
2020). Another way airlines cope with air cargo demand imbalances is by
applying a hub and spoke network. By using a hub and spoke system,
airlines can consolidate air cargo flows in their hub to optimise their
capacity and increase their revenues. Although air cargo was considered
a by-product for passenger airlines in the past, the COVID-19 pandemic
made those airlines rethink their cargo activities to survive. One of
the main problems in air cargo research is the shortage of publicly
available air cargo data. Although some data published in reports by
major institutions like IATA1, ICAO2 or
Boeing3 are available, their data are
generally published on an aggregated market or region level. Although
comprehensive disaggregated data is often published by organisations
like EUROSTAT or the US Bureau of Transport Statistics for a certain
region, collecting disaggregated data for other regions or combining
those datasets to build a comprehensive dataset comprising all regions
and countries can be rather time-consuming.
This papers comprehensive actual flow database is constructed through
intensive data collection. Flight data from three main flight-tracking
websites were collected, cleaned and combined into a database. The
database consists of data from January 2018 until December 2022.
Although data from flight tracking websites were already sources in
previous research (Bombelli, 2020; Bombelli et al., 2020; Malighetti et
al., 2019a and 2019b), it will be the first time data from three
different sources and over five years were collected and combined.
Combining heterogeneous datasets can be a rather tedious task as it
might cause challenges. The main challenges found were the different
features published by the different sources, time zone deviations,
mismatches in departing and arrival timings, and missing data. We
addressed those problems by working with features that were available
for all rows, transferring all rows to the same time zone, working with
time buckets, and removing rows that were not useful due to the missing
data. Afterwards, we compared the Available Cargo Tonnes (ACT) of 2021
of our comprehensive database with the ACT numbers IATA published. Next
to introducing a comprehensive flight database, we also introduce, to
the best of our knowledge, the first international sales tonnes data
into the academic literature. Sales tonnes data are the actual tonnes
sold and transported by air without double counting due to transfers or
in transit. Both datasets were used to estimate the air cargo demand and
supply on industry and region-to-region levels. Different types of data
originating from different sources are compared to indicate the
importance of understanding which data types are used. After providing a
market overview of air cargo demand, supply, and rates, a
region-to-region analysis for the 2022 data is conducted to estimate the
amplitude of the air cargo sales tonnes flows and imbalances between
different regions. The same analysis is conducted for the supply side
for wide- body belly capacity, dedicated freighter capacity and
integrator capacity.
The rest of the paper is organised as follows. Section 2 provides an overview of the
current air cargo demand studies, supply studies, and data sources used
in the academic research. Section 3 presents the
methodology and data collection process. Section 4 gives an
overview of both air cargo demand and air cargo supply on an aggregate
level and discusses data problems of different sources and problems when
comparing different sources. Section 5
focuses on the air cargo demand and supply imbalances separately and
compares both imbalances. Section 6 provides conclusions,
limitations and recommendations for future work.
2 Literature review
Although air cargo studies are generally considered underrepresented
in the academic literature compared to their passenger counterparts, air
cargo research has received growing interest in the last fifteen years.
Air cargo studies can be classified into four broad categories (Yu and
Zou, 2022); (1) competition and connectivity of airports in the air
cargo market, (2) air cargo market structure and airline competition,
(3) air cargo operations, and (4) analysis and estimation of air cargo
demand and its relationship with economic or trade growth. This research
will focus on the second aspect, particularly the air cargo market
structure, and on the fourth aspect, the analysis of air cargo demand.
Of the main aspects that will be analysed in this paper, air cargo
demand is the most extensively discussed in the current literature.
2.1 Air cargo demand
While there is a general agreement that air cargo transport, as cargo
transport in general, is the result of economic activity and, therefore,
an operationally derived demand (Rodrigue, 2006; Kupfer et al., 2017),
there are some discrepancies in how air cargo demand is derived. Grin
(1998) discusses that air cargo demand can usually be seen as a derivate
of transport, which in itself is a derivate of trade. Meanwhile,
Holloway (2008) states that air cargo depends on the underlying demand
for goods requiring rapid transportation as well as on the costs and
benefits of air cargo compared to alternative modes of transportation.
Those discrepancies are present in defining how air demand can be
derived and determining the underlying parameters for air cargo
forecasting. Most air cargo demand studies focus on the relationship
between air cargo and economic growth (Alici and Akar, 2020). The Gross
Domestic Product (GDP), an indicator of economic development, is one of
the most studied determinants for air cargo by academic researchers.
Kasarda and Green (2005) study the empirical relationships between air
cargo, trade, and GDP per capita to quantify air cargos role in economic
development. Wadud (2013) simultaneously forecasted demand for passenger
and cargo at the Shahjalal International Airport using GDP, national
price levels, and oil prices as determinants for the demand. Morrell and
Klein (2018) identified GDP, international trade, oil prices, exchange
rates, interest rates, and globalisation as key variables for
forecasting future air cargo demand.
Although GDP is a good indicator of the growth and health of an
economy, the role of GDP in air cargo demand forecasting can be
questioned (Kupfer et al., 2011). Last decades the development of the
importance of services in GDP caused the relationship between GDP and
air cargo to become less straightforward. While services made up 53% of
the world GDP in 1970, this number increased to 64.4% in 2021.
High-income countries generally have a higher share of services in their
GDP, for example, a share of 71.8% in high-income countries versus 39.1%
in low-income countries (Worldbank, 2022). As a result, global value
added is increasingly being generated by services rather than economic
activities that may generate air cargo. Kupfer et al. (2017) propose to
use merchandise trade and share of manufactures in merchandise trade
instead of GDP and industrial production, which is often used to
represent the link between economic activity and transport and can also
be considered a weak indicator for air cargo. Other authors (Hamal,
2013; Lakew and Tok, 2015; and Alexander and Merkert, 2021) also
forecasted air cargo demand at airport, regional, and country levels
without using GDP as an indicator.
Boeing (2022) states that although air cargo accounts for less than
1% of the world’s trade tonnes, it is responsible for about 35% of the
value of all globally shipped goods, indicating the high value of these
goods. Air cargo commodities can be classified in different ways and
product types based. The IATA classification, which divides air cargo
into general and special cargo, is widely used in the industry. Special
cargo are goods that, due to their nature, weight, dimensions, and/or
value, may have specific requirements, including packaging, labelling,
documentation, and handling through the transport chain. The transport
of those goods is addressed through specific regulations that must be
followed when preparing, offering, accepting, and handling this cargo
(IATA, 2023). Special cargo is subdivided into the following products;
valuable, pharmaceuticals and temperature-controlled, live animal,
vulnerable, dangerous, and perishables products. One of the
classifications flaws is the large allocation to general cargo. Another
classification for air cargo commodities was made by Doganis (2010),
classifying air cargo into manufacturing goods, machinery and transport
equipment, and a remaining part consisting of a variety of different
commodities, among which fresh foods, medical and pharmaceutical goods,
as well as chemicals, are of particular importance. Each of the three
classes comprises one-third of the worldwide air cargo tonnes. In
addition to those two classifications, each countrys statistical and
data embodiments have their classification of air cargo products, making
data source comparison difficult. Many authors (Holloway, 2008; Doganis,
2010; Shaw, 2016) prefer to segment the air cargo market based on the
shipper’s motivation and journey urgency rather than considering
individual commodities. They identified four key commodity types in
increasing order of price sensitivity: emerging freight, high-value
freight, routine perishables freight, and routine non-perishable
freight. Whatever classification system is used, there are differences
in air cargo flows when comparing regions, countries, and airports, as
indicated by Boeing’s world air cargo market forecast.
According to Zhang and Zhang (2002), economic activity in the
importing region drives cargo movement from manufacturing to
distribution centres or from production to consumption centres.
Different levels of commercial activity at either end of a route can
amplify directional imbalances in cargo tonnes, and commodities carried,
mainly if the two points are at different stages of the economic cycle
(Holloway, 2008). This effect of the economic activity in the importing
region and the various stages of the economic cycle also explains the
different types of products transported by air on a region, country, and
route level. On the Europe-East Asia route, for example, 27% of cargo on
the East Asia-Europe leg consists of computers, office, communications,
and professional equipment. In comparison, those goods represent only 8%
of the air cargo flown on the Europe to East Asia leg. Both Boeing
(2022) and Morrell and Klein (2018) provide an overview of the main
imbalances in air cargo demand. The data they used is actual tonnes
carried data and includes transfer and in-transit data. By including
this data type, they analyse the imbalanced carried flows rather than
the actual import and export imbalance between regions.
2.2 Air cargo supply
Airlines have different strategies when it comes to cargo operations.
Generally, airlines handling cargo can be divided into integrators,
freighter carriers, combination carriers, and passenger carriers (Li et
al., 2012). Integrators (e.g., DHL, UPS, and FedEx) sell capacity to
shippers directly through direct market channeling. Through indirect
market channeling, they sell their excess capacity to freight
forwarders. Freighter carriers are airlines dedicated to transporting
air cargo (e.g., Cargolux). Those airlines only operate dedicated
freighter aircraft and sell their capacity through indirect market
channeling. Combination carriers only transport cargo with passenger
aircraft (e.g., British Airways) or with both passenger and dedicated
freighters aircraft (e.g., Lufthansa). Passenger airlines focus on
passenger operations and do not transport cargo (e.g., Ryanair). (Feng
et al., 2015). Historically, air cargo was considered a by-product of
passenger transport. In the last twenty years, many traditional carriers
have considered it an instrument for profit maximisation (Kupfer et al.,
2012). Focusing simultaneously on cargo and passengers can enable
multiple benefits for passenger carriers (Gangwani, 2015). Air cargo
allows passenger carriers to offer routes that are not commercially
viable on passenger demand alone but also enables them to offer higher
frequencies on their existing routes. Due to the marginal costs of
transporting cargo into the belly hold of passenger aircraft, carriers
can increase and diversify their revenue streams and margin per
route.
Cargo can be transported on different types of aircraft. The most
common breakdown in academic literature divides aircraft into passenger,
freighter, combi, and convertible aircraft. Most aircraft are passenger
aircraft transporting passengers on the main deck and luggage and cargo
on the lower deck. Freighter aircraft only transport cargo and can be
either dedicated or converted. Dedicated freighters are aircraft
designed from the beginning only to transport cargo, while converted
freighters are passenger aircraft converted to freighter aircraft. Due
to previous passenger requirements, the last type has some payload
restrictions that dedicated freighters do not have. Convertible aircraft
are limitedly built and can switch the number of seats on the main deck
to allow more or less cargo payload. Although those aircraft were famous
in the past, today, they can be considered neglectable due to the
minimal number of those aircraft in the overall fleet. In the academic
literature, the focus can be on all aircraft types (Kupfer et al., 2011;
Morrell and Klein, 2018; Bombelli et al., 2020), freighter aircraft
(Budd and Ison, 2017), or passenger aircraft (Merket and Ploix,
2014).
Both passenger and freighter aircraft have their benefits and
limitations. First, freighters are generally used in markets with higher
demand for cargo than passengers and markets with an imbalance between
incoming and outgoing cargo (Kupfer et al., 2011). Second, freighter
aircraft are used to transport cargo that, due to its dimensions or
hazardous characteristics, is not suitable to be transported in
passenger aircraft (Merket and Ploix, 2014). Although there is a market
for hazardous and oversized cargo, only 5 to 15% of all air cargo is
bounded to be transported on freighter aircraft (Boos, 2015). Third,
freighter aircraft are particularly well suited for transporting
high-value goods because they provide highly controlled transport,
direct routing, reliability, and unique capacity considerations (Boeing,
2017). Last, the capacity of freighter aircraft is fixed, which is
different for belly capacity with a varying capacity to short-term
variations in passenger numbers and luggage weight and sizes (Amaruchkul
et al. 2010). This guaranteed capacity offers airlines and consignors
better flown-as- booked rates (Crabtree, 2014). The belly capacity of
passenger aircraft is smaller than the cargo capacity of freighter
aircraft. Therefore, the marginal costs of filling up this capacity are
generally only one-third of the cost of filling up a freighter capacity
(Morrell and Klein, 2018). The lower marginal costs make belly capacity
particularly suitable for air cargo products with lower yields, like
some types of perishables and general cargo.
In the last couple of years before the COVID-19 pandemic, around half
of the air cargo was transported on freighter aircraft, and the other
half was transported as belly cargo on passenger aircraft. As discussed
in the previous section, different levels of commercial activity at
either end of a route can amplify directional imbalances in cargo
tonnes. This uneven spatial nature of air cargo demand is often referred
to as the backhaul problem (Budd and Ison, 2017). Although the backhaul
problem causes airlines to struggle with finding enough volume to fill
their capacity on some legs, airlines operating freighters often fly
triangular and multisector routes to cope with this problem. Bombelli et
al. (2020) presented a complex network analysis of the air transport
network using the air cargo perspective. They found that the percentages
of origin-destination airport pairs served in both directions and in a
single direction are 77 and 23%, respectively. Because of the
bi-directional nature of passenger traffic, belly capacity is bound to
fly both legs of the same route, making the backhaul problem even more
significant for belly capacity. Due to the backhaul problem, the higher
capacity uncertainty of belly capacity, and the passengers’ luggage, air
cargo weight load factors are lower on belly capacity than on freighter
capacity (Morrell and Klein, 2018). Following IATA (2021), the all-cargo
flight freight load factor was around 65%, while the mixed flight
freight load factor was around 36%. Regarding integrator network
analysis, Bombelli (2020) found very imbalanced air cargo flows for
FedEx and UPS towards their hubs in MEM and SDF, and more balanced flows
for the DHL network from November 2019 till June 2020.
Another way airlines, and especially Middle Eastern Carriers, cope
with the backhaul problem is to employ a hub and spoke network using
their strategically located hub to feed and defeed freighter and belly
capacity (Budd and Ison, 2017). Hubs are even more critical for air
cargo than for air passengers. While the top ten passenger hubs account
for only one-third of global passenger traffic, the top ten cargo hubs
account for two-thirds of global freight traffic (Holloway, 2008).
Integrators atypically operate from a hub and spoke network in North
America, but Malighetti et al. (2019b) also found hub and spoke networks
for the European market. Malighetti et al. (2019a) studied the air
transport networks of global integrators in the more liberalised Asian
air cargo industry and found that integrators operate extensive multi-
hub networks in the Asian market as well. Air cargo has a much larger
catchment area than the air passenger side. The larger catchment area
allows airlines to feeder their flight by trucking. Especially in
Europe, where trucking distances are relatively small and good
infrastructure is present, trucking is common. Although it is common,
Baier et al. (2021) argue that a quantitative approach to automate a
clear-cut catchment area of airports for air cargo is complex due to the
unprecise trucking networks processing airfreight from and to airports.
Although freighter aircraft carry around half of the total air cargo,
their role has often been questioned and examined. Following the
financial crisis in 2008/2009, there was overcapacity in the market,
causing airlines to ground and retire freighter aircraft. In times of
crisis and overcapacity, airlines switch from freighter aircraft to
belly-capacity aircraft (Kupfer et al., 2017). The overcapacity was
present due to the economic downfall causing lower air cargo volumes to
be transported, new passenger aircraft with higher belly hold capacity,
a modal shift towards cheaper sea shipping, and an increase in
international trade protection measures restricting cross-border trade
(Budd and Ison, 2017). Although new aircraft have higher payloads for
air cargo due to increased size and fuel efficiency gains, their impact
on overcapacity is not yet significant (Boeing, 2017). Although the
general grounding and retirement of freighters in this period, in some
world regions, the demand for freighters kept growing (Budd and Ison,
2017). In times of crisis and overcapacity, airlines switch from
freighter aircraft to belly-capacity aircraft. Although many freighter
aircraft were not expected to have a future any longer, the COVID-19
pandemic caused freighter aircraft to be a crucial asset in transporting
air cargo. Ageing cargo aircraft were being taken out of storage and
returned to service (Macário and Van de Voorde, 2022).
2.3 Air cargo data sources
Publicly available air cargo data for academic purposes are scarce.
One of the reasons for this scarcity can be found in the confidentiality
of the data and the competition for the data (Bombelli et al. 2020). The
problem is even more severe when it comes to integrator data (Lakew,
2014 and Malighetti et al., 2019a). Gong et al. (2017) claim that the
shortage of comprehensive data on price and traffic volumes at the route
or airline level is one of the main reasons air cargo is lesser
developed than its passenger counterpart. This conclusion was also found
by Wei (2006), who indicated that the unavailability of sufficient,
accurate and consistent data in the air cargo industry is one of the
reasons for the lack of in-depth air cargo research. Although there is a
scarcity of publicly available aviation market data for academic
research, some nuances can be made.
First, large institutions and companies like IATA, Boeing, and the
ICAO often collect and make publicly aggregated market data available.
IATA publishes the IATA World Air Transport Statistics (2021) on a
yearly level providing information on air cargo demand, capacity and
payload levels. One of the shortcomings of this database, other than the
unavailability of public access, is the level of aggregation of the
data. Although a distinction is made between international, domestic,
scheduled, charter, and all cargo flights, the data is aggregated per
airline per year. This makes the data suitable for more aggregated
research but less suitable for more disaggregated analyses, especially
for origin-destination research. Publicly available air cargo data for
those three sources do not come in the form of datasets but can rather
be found in reports. One of those reports is the monthly Air Cargo
Market Analysis from IATA (2014-2023). Those monthly reports provide an
update on the current situation of the air cargo market and data on air
cargo demand and supply on an international and main region level. One
of the shortcomings of the data is that those reports often publish
percentage change data rather than absolute numbers. However, some
reports also include actual numbers, which makes it possible to use
those percentages to estimate the missing absolute numbers. The same can
be done for IATA’s quarterly Air Transport Chartbook reports (IATA,
2015-2023) and for ICAO’s Annual Reports of the Council (ICAO,
2008-2021). Next to the time-intensive task of analysing all those
reports, the methodology of how the data behind those reports are
collected is often unclear. Next to both sources, Boeing publishes its
bi-annual World Air Cargo Forecast and its commercial market outlooks
(Boeing, 2022). Because only the latest report is published on the
Boeing website, older reports are often more difficult to obtain. Unlike
the IATA and ICAO reports, Boeing published more absolute figures in its
report making the reports more convenient to use. However, much detailed
or older data is still hidden in graphs and percentages, which can be a
shortcoming if you are looking for those specific data.
Second, disaggregated data is also often available, but the task of
collection and cleaning is time-consuming. Disaggregated air cargo
demand data is often published in countries’ databases and can be
accessed through a web portal or an application programming interface
(API). Although looking for the data is not necessarily time-consuming,
cleaning the data due to inconsistencies between sources, methodologies,
data types, and data features is. Disaggregated air cargo supply data is
often more hidden than its demand counterpart. Wei (2006) discussed that
the problem of inconsistencies between disaggregated data sources and
not knowing which data source is the most accurate or consistent is one
of the main problems in air cargo data. Wei (2006) explored the
available data sources and databases related to air cargo studies to
investigate what data are available and what analysis can be made based
on current data sources to study air cargo activity at a state level,
specifically in California. Eight major, mainly North American data
sources were studied and explained. He found that the data of those
sources either came from airlines, airports, or shippers who each report
data collected from their own perspective. The airline data mainly
originates from the US Bureau of Transportation Statistics (BTS) who
collects and compile data from certified air carriers on Schedules T-100
and T-3. Airport data is mainly published by airports themselves and by
the Airport Council International (ACI), who publishes the Annual
Worldwide Airport Traffic Report based on a survey of large airports
worldwide. The last type of data, originating from shippers and
logistics companies, is obtained by the Commodity Flow Survey (CFS). CFS
is a survey of shipments by domestic establishments in manufacturing,
wholesale, mining and selected other industries. Because all sources
collect data considering their own perspectives, it is not surprising
that the published data of the above sources are inconsistent. A second
problem between those databases is that some important features are
missing, such as the value of the goods transported, the routing of the
goods, the production location, the final destination, etc. The last
problem is with the CFS database. Although Wei (2006) considered the CFS
database to be the most ‘useful’ as the database classifies the data of
the flow of types of goods and materials by mode of transport, the
database is not published yearly. The latest publication that could be
found was of 2017.
Table 1 provides an overview of large data sources used in the
academic literature. With large data sources, we refer to sources that
cover the whole world, like the Official Aviation Guide (OAG) database
or the Airport Council International (ACI) database, or data sources
that cover a large region, like the US Bureau of Transportation
Statistics (BTS) or Eurostat, the database of the European Union and its
partnering countries. Datasets only covering large regions of certain
continents, like BTS or Eurostat, are often used to conduct case studies
or to analyse certain routes, regions, or sub-regions (Bowen, 2012 and
Morrell and Klein, 2019). Bowen (2012) used the BTS data of 2010 to
assess the network evolution of both FedEx and UPS. Although the
database is relatively complete, he argued that one of the shortcomings
was that there was no data on integrators’ traffic carried on partner
airlines which could slightly affect their results. A database used in
air cargo tis the OAG database. The OAG database consists of historical
published flight schedules, excluding actual non-scheduled flights and
non-IATA members’ flights (Heinits and Meincke, 2013). Although charter
flight takes up around 5% of the international air cargo capacity
(Boeing, 2009-2021), the impact of the missing charter data in the OAG S
is yet unsure. The problem of missing charter and non-scheduled flights
is not only a shortcoming of the OAG but also of the Seabury Consulting
dataset. Bombelliet al. (2020) discussed that the Seabury Consulting
dataset was missing integrator, LATAM, charter and other non-scheduled
flights. The dataset they received from Seabury Consulting contained
origin-destination data for 2014. They collected the missing data to
fill the gap using the flight tracking website FlightRadar24. Although
flight tracking websites have been around for quite some time, it is
only recently that authors like Malighetti et al. (2019a and 2019b),
Bombelli et at. (2020) and Bombelli (2020) started collecting actual
flight data for air cargo purposes, mainly network analyses. Although
those types of data can be very useful for analysing market dynamics,
competition analyses, route scheduling problems etc. as they are very
disaggregated, the collection of such data is highly time-consuming as
the data is often only available for one week.
Table 1: Major air cargo data sources used in publications.
Reference
Objective
Data Source
Description
Constraints
Bowen (2012)
Assessment of the network evolution of
FedEx and UPS
US Bureau of Transportation Statistics
(BTS)
Monthly reported domestic and
international airline data for certified U.S. air carriers and data of
foreign carriers having at least one service point in the United States
or its territories. Data for 2010.
No data are recorded for sectors that
begin and end outside the US. No data on integrator traffic carried on
partner airlines.
Heinitz and Meincke (2013)
Construct a multistep, twofold
capacity-restrained itinerary-based demand assignment algorithm.
Official Aviation Guide (OAG)
Published recent and historically
scheduled flights. Sample data for a week in 2007.
The dataset excludes the actual
non-scheduled flights and flights of non-IATA airlines, such as
integrators.
Song and Yeo (2017)
Analysis of the air transport network
using the social network analysis approach.
Airport Council International (ACI)
Data on the top 20 airports in 2016 based
on passenger, cargo, and movements.
No data is publicly available outside the
top 20.
Song and Yeo (2017)
Analysis of the air transport network
using the social network analysis approach.
Web pages of airlines alliances
Reconstruction of the route network in
March 2017, taking into account 1,060 airports in 173 countries. In
total, 5,580 routes were constructed.
Exclusion of non-alliance members. Focus
on international rather than domestic routes.
Morrell and Klein (2019)
Providing an overview and status of the
air cargo industry
Eurostat
Overview of traffic between
origin-destination airports where at least one airport is located in the
European Union or one of the partnering countries. Overview of data from
2006 until 2016.
None
Morrell and Klein (2019)
Providing an overview and status of the
air cargo industry
BTS
See Bowen (2012). Data for 2015.
See Bowen (2012)
Morrell and Klein (2019)
Providing an overview and status of the
air cargo industry
Boeing WACF
Overview of aggregated air cargo flows
between pre-defined major regions based on 2015 data.
Data is only available for the major
region pairs, neglecting smaller air cargo flows.
Morrell and Klein (2019)
Providing an overview and status of the
air cargo industry
IATA WATS
Overview of aggregated air cargo carried
per airline in 2016.
Data is not publicly available
Malighetti et al. (2019a)
Analysis of the Asian air integrator
networks by graphical analysis and complex network metrics.
FlightRadar24
Data on flights “departing from” and/or
“arriving at” one of the airports located in Asia. Sample data for one
week in 2015.
Not possible to investigate a temporal
evolution of the network since the data set merely provides a picture of
the networks’ structures.
Malighetti et al. (2019b)
Network analysis of the integrators in
Europe
FlightRadar24
See Malighetti et al. (2019a)
See Malighetti et al. (2019a)
Bombelli et al. (2020)
Complex network analysis of the air
transport network using the air cargo perspective
Seabury Consulting flight schedule
database
List of airports characterised by a yearly
international cargo throughput of 5,000 tonnes or higher + the yearly
frequency per aircraft type for all OD airport pairs. Dataset was based
on 2014 data.
Integrator, LATAM Cargo, narrow body
passenger, charter and other non-scheduled operation data excluded
Bombelli et al. (2020)
Complex network analysis of the air
transport network using the air cargo perspective
FlightAware
All recorded departures were collected for
each airport part of the air cargo transport network. Data was collected
from June 2019 until January 2020.
Only data for seven months due to time
limitation
Bombelli (2020)
Analysis of the global networks of
integrators using network science
Flightradar24 and FlightAware
Pre-selected a set of 336 airports deemed
relevant from a cargo perspective (i.e., with an annual cargo throughput
in 2014 greater or equal to 5000 tonnes. Data were collected from
November 2019 until June 2020.
Ruling out lower-tier airports Temporal
holes due to not starting the data retrieval process at the correct
time
Due to the time intensity of the data collection, the authors only
collected the data from one week to a few months. Although taking
samples might be interesting to get a picture of a certain moment in
time, it would be more interesting to analyse market dynamics to better
understand those pictures evolution. Although this paragraph provides a
basic overview of data sources used in air cargo research, there is a
need for more in-depth analyses of air cargo sources to understand their
benefits and shortcomings. Next to understanding those data sources and
their differences, there is also a need to find or construct a benchmark
database against which other sources can be compared.
2.4 Summary and contribution
In summary, the current academic research on air cargo market
dynamics needs to be enhanced. Although some research has already been
conducted on air cargo demand and supply separately, much research is
yet to be done on a combined analysis of both demand and supply. One of
the main problems in the current literature regarding air cargo is the
need for more comprehensive data, which is required to perform more
in-depth analyses to better understand air cargo market dynamics. The
contribution of this paper is twofold: (1) New air cargo demand and
supply data is collected from various sources and combined into one
comprehensive dataset. (2) The dataset is used to analyse both air cargo
demand and supply imbalances on a region-to-region level separately and
simultaneously.
3 Methodology and data
description
3.1 Methodology
This research uses an inductive approach to conduct an air cargo
data-driven market analysis on the global market and the main trade
lines. Air cargo-related market data on the network, demand, supply, and
aircraft will be sourced from multiple sources on a disaggregated market
level. The data will be jointly analysed to provide an overview of the
air cargo market and identify patterns and relations. The inductive
approach is chosen for two reasons. First, air cargo market research is
scarce, and few theories have yet to be developed. The inductive
approach allows us to start with market observations and develop new
theories and insides through analysis and pattern recognition to fill
this gap in the current literature. Second, the air cargo market is
complex, with different sub-market characteristics. The inductive
approach allows us to start with disaggregated data to better understand
those complex dynamics before going to a more aggregated level.
3.2 Data
The air cargo data collection for this research was carried out over
one year, where data from different sources between 2018 and 2022 were
collected. First, aircraft data was sourced from Airfleets4 and
PlaneSpotter5. Both sources provide information
about aircraft movements between operators and provide an overview of
the status of airframes for all airlines worldwide. The registration
plate data for all wide-body and narrow-body freighter aircraft between
2018 and 2022 were collected. This way, the actual and historical
registration plates for the aircraft were included. The collected
wide-body registration plate data was used as input on flight tracking
websites to collect flight data. Three flight tracking websites were
considered: Flightera6, Flightradar247 and
FlightAware8. All have published flight data on
flight date, origin, destination, actual departure time, arrival time
and flight duration for each registration plate. Flightera and
Flightradar24 also provide data on the flight number. Data from
Flightera is freely available for December 2017 onwards and was
collected from January 2018 until February 2022. Flightradar24 data was
collected from October 2019 to December 2022. FlightAware data was
collected from October 2021 until December 2022. Due to resource
constraints, mainly time constraints as collecting such an amount of
data can be rather time intensive, the narrow-body freighter data was
only collected from FlightAware and Flightradar24 for 2022. All the
collected data were combined. Combining heterogeneous datasets can be a
rather tedious task as it might cause challenges and problems. Next to
differences in features published or missing data, dealing with near
duplicates due to time zone differences or time deviations were also
major challenges. Those four challenges were solved as follows:
When comparing and integrating those sources, the first challenge
tackled was the mismatch of features between the different flight
tracking websites. All sources published data on the day, month and year
of the flight, the origin and destination, and the departing and
arriving times. Due to the scope of this research, those features were
sufficient, and all the others were removed. Although those features are
sufficient for the purpose of this research, flight code or scheduled
departure and arrival times might be interesting for future research.
The flight codes can be interesting in identifying the code-sharing
behaviour of airlines, analyses of individual airline networks or
calculation of market shares on certain routes and networks. Scheduled
departure and arrival times can be interesting for airport analyses,
airline punctuality, or for research towards airport optimisation
models.
The time-zone problem was solved by converting all times to the
Coordinated Universal Time (UTC).
The small mismatches in timings were partly solved by counting
the flights with the same data, origin, destination, and registration
plate per source. First, if there were no duplicates, we assumed that
there was only one flight with that specific aircraft between the origin
and destination on that day. The results for all three sources were
compared, and the timings were considered if the flight had no
duplicates in all sources. If the differences between the UTC timings
between all three sources were less than 15 minutes, we assumed those
flights to be duplicates. The decision must be taken manually if the
difference was higher than 15 minutes, which was rarely the case.
Second, if duplicates were found or some sources found a duplicate while
the others did not, time brackets of one hour were used, meaning that
each timing was rounded to the closed hour. Afterwards, the process was
repeated, including the new time brackets. If there were still problems,
those cases also needed to be checked manually. We are aware that this
probably does not solve all mismatched timing and that one of the two
can be rounded off to the previous hour while the other can be rounded
off to the next hour. Although we acknowledge that our methods of
dealing with mismatches in timings are not perfect, we believe the
overall impact to be limited.
Regarding the missing data features, the main missing features
were origin or destination related. As filling in the missing data was
impossible, those rows were removed.
Afterwards, we compared the Available Cargo Tonnes (ACT) of 2021 with
a correction of the narrow body freighter capacity of 2022, as we do not
have them for 2021, of our comprehensive database with the ACT numbers
published by IATA in its quarterly chartbooks (2015-2023). We found our
ACT data to be 6.3% above that of IATA. Although the 6.3% may indicate
that not all duplicates were removed, we believe the maximum payload for
each aircraft used can explain the difference. Because the maximum
payload is seldom reached, our data is subject to overcalculation which
might explain the 6.3%. Because we are aware that our methods are not
perfect, we believe more research is required on the integration of
different sources, the payloads used, and the comparison of our dataset
with more data sources to validate our methods.
Combining those three sources allows for a more comprehensive
database. The combined database is then compared to the three sources
individually to assess the accuracy of each source. Flightradar24 was
the most comprehensive source covering 91% of the combined database.
FlightAware covers 88%, and Flightera 83%. As Flightera is our prime
source for January 2018 until September 2019, a deeper dive into the
data was conducted to understand better which data is missing leading to
an 83% accuracy. As it turns out, wide-body passenger aircraft flights
have an accuracy of 96%, even higher than the Flightradar24 data. The
problem is with the full freighter data. By analysing the freighter data
on a daily level, a steep decline of 50% of data is found in July 2019.
Extra freighter data from May 2019 until September 2019 was collected
from Flightradar24 to determine if the decline is due to data issues or
sudden events in the market. As the Flightradar24 data does not show any
decline, we concluded that the Flightera data has a gap in freighter
data from July 2019 onwards. This gap was filled by including the extra
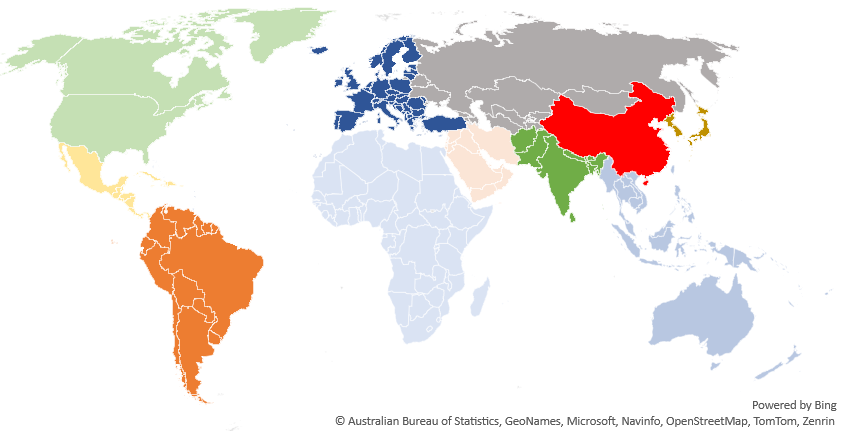
Flightradar24 data. The combined database was cleaned by combining the
origin and destination IATA codes with their respective countries,
regions, and coordinates. The regions are defined as shown in Figure 1;
North America (NA), Central America (CA), South America (SA), Europe
(EU), Africa (AF), Middle East (ME), Russia and Central Asia (RU),
Northeast Asia (NEA), Southeast Asia (SEA), China (CH), and Indian Sub-
Continent (INS). The available maximal payload was applied for each
flight based on the cargo tonnes for different aircraft types defined by
Bombelli et al. (2020). For the missing aircraft types, the A350-900,
the A350-1000 and the B787-10, a payload of respectively 17 tonnes, 25
tonnes, and 13 tonnes was applied (IAG, 2023). Each flight was given an
identifier to allocate capacity to wide-body, freighter or integrator
aircraft.
Figure 1: Region definition.
The demand data originates from the World Air Cargo Database
(World_ACD). The World_ACD collects and combines Air waybill (AWB) data
to build a comprehensive air cargo market database. This database
provides sales tonnes, expressed in both chargeable and actual weights,
data from an origin airport or city to its final airport or city. The
sales tonnes data includes charters-on-AWB data and mail-on-AWB data but
excludes express flown by integrators and charter and mail data not sold
on AWBs. Chargeable weight can be defined as the measurement used by
cargo carriers to determine the price for the shipment of your goods. It
can either be the gross weight or the shipment’s volumetric weight (Chao
and Li, 2017). The data is provided for the period 2018 until 2022 and
is provided on a country-to-country level. The country-to-country data
are transferred to region-to-region data based on previously defined
regions. The data also includes trucking on AWB data, but we believe the
impact will be limited due to the aggregation of the data to regional
levels. Next to the World_ACD data, demand and supply data was collected
from IATA’s quarterly published air cargo chartbook as well as from
IATA’s monthly published air cargo analysis. Next to IATA, data are also
sources from Boeings’ world air cargo forecast published bi-annually and
from ICAO’s annual report of the council.
4 Aggregated global market
analysis
This section will discuss air cargo demand and supply based on
aggregated global market data. Different types of air cargo demand data
sources are compared and discussed. Afterwards, the role and impact of
double counting due to transfer data are explained. Regarding the air
cargo demand, the air cargo capacity is estimated and allocated to
wide-body belly capacity, freighter capacity, and integrator capacity.
Finally, both air cargo demand and supply are compared and air cargo
rates are included.
4.1 Air cargo demand
Air cargo demand data are the most readily available. The most common
unit of measurement of air cargo demand is the Freight Tonne Kilometre
(FTK), representing the transport of one tonne of freight over one
kilometre. Multiple international organisations publish air cargo demand
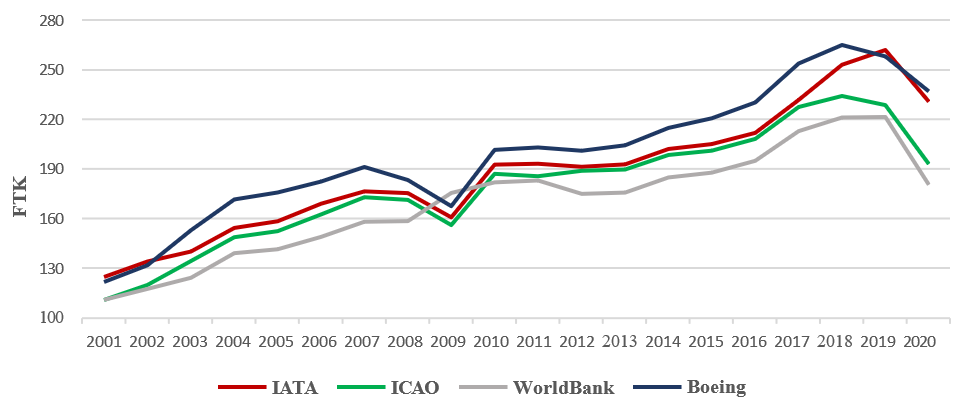
data expressed in FTK. Figure 2 shows the FTK data IATA, ICAO, the World
Bank, and Boeing9 provided from 2001 until 2020. As
Figure 2 illustrates, reported FTK data from different sources shows
discrepancies. Those discrepancies are common, as each organisation has
its methodology for collecting and defining FTK.
For 2003-2017, IATA and ICAO data are relatively similar. The
similarity is not a coincidence, as both sources publish scheduled FTK
data. Although both sources publish the same kind of FTK data, since
2018, the IATA data has suddenly increased compared to the ICAO data. In
the last few years, IATA started using Cargo Tonne Kilometres (CTK)
rather than FTK as their main reporting unit for air cargo demand. CTK
data included freight, mail, and unaccompanied baggage. Although the
data for those years was reported in FTK, we assume it is probably CTK
data as it matches other CTK data published by IATA. Unfortunately, no
confirmation by IATA could be found. The FTK data published by Boeing
are higher than IATA’s or ICAO’s figures. The difference can be found in
charter data, as Boeing issued actual rather than scheduled data. The
World Bank data, a source often used for forecasting air cargo demand,
is based on ICAO data. For most of the years, it follows the same trends
as the ICAO data, except in 2009, where it increased while all the other
sources show decreasing demand due to the financial crisis. Regarding
data usage and comparison from institutions, one must take into account
which data is included or excluded.
Figure 2: Industrys freight tonne kilometre evolution.
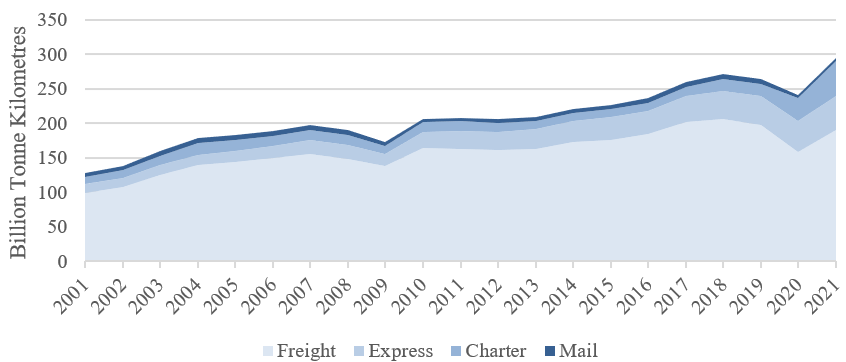
Figure 3 illustrates the global evolution of actual cargo
tonne-kilometres performed by the industry. The growth of air cargo is
similar to the growth of air freight, with a drawback in 2008 and 2009
due to the financial crisis and in 2020 due to the COVID-19 Pandemic.
The first drawback can also be found for international express cargo, as
the financial crisis impacted the purchasing power of the customers.
Compared to the second drawback of freight in 2020, express boomed by
8.1% compared to 2019. This increase can be explained due to people
spending more money on online shopping as they needed less money for
social activities and travelling due to lockdowns. International express
cargo is the quickest-growing air cargo segment growing from an
international market share of 13.4% in 2008 to 21% in 2021. Compared to
the ever-increasing express segment, the air mail segment steadily
decreased from a market share of 5.2% in 2001 to 1.8% in 2021. Although
the market share of air mail has been declining slowly over the last 20
years, the COVID-19 pandemic accelerates this decrease. Although the air
cargo charter market is a small part of the general market, with a
market share of around 6.9% before COVID-19, the COVID-19 pandemic
caused the charter market share to almost triple to 17.3% in 2021. Most
charter data is often neglected in analysing the market due to the use
of scheduled data; this increase must be addressed when observing data
from 2020 onwards. Therefore, working with actual flown data rather than
scheduled data is essential.
Figure 3: Industry’s freight, express, charter and
mail-tonne kilometre evolution.
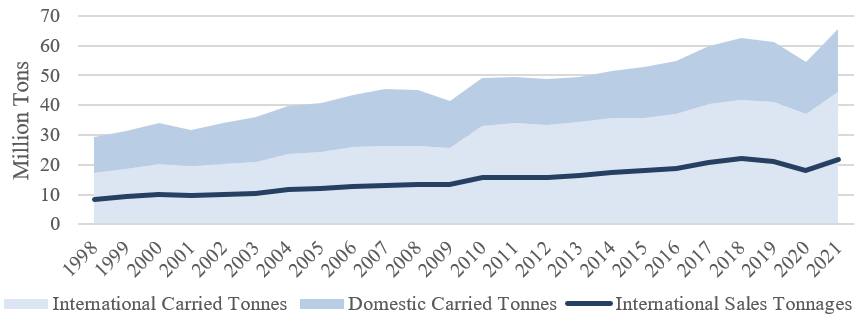
Next to FTK and CTK, another unit of measurement for air cargo demand
often used is carried tonnes. Carried tonnes express the actual weight
of all cargo transported. Figure 4 illustrates domestic and
international cargo tonnes carried from 1998 until 2021. In the first
ten years, domestic and international traffic experienced an average
growth of 4.37% per year. From the financial crisis in 2008 onwards,
international cargo traffic, with an average annual growth of 4.75%,
outperformed the 2.42% average annual growth rate of domestic
traffic.
From a financial point of view, another unit of measuring air cargo
is sales tonnes. Sales tonnes are the air cargo sold at a specific price
and transported from an origin to a final destination airport or city as
provided on the air waybill (AWB). Sales tonnes data exclude transfers,
thus excluding double counting, and are at the bases for calculating
revenue as air cargo rates are multiplied by them. Figure 4 illustrates
the international carried tonnes to be higher than the international
sales tonnes indicating much double counting into the industry. Due to
the missing express data of integrators in the World ACD data, the
international carried tonnes cannot be divided by the sales tonnes to
estimate how much double counting there is in the industry.
Figure 4: International versus Domestic carried Tonnes and
International Sales Tonnes.
4.2 Air cargo supply
Unlike air cargo demand, previously discussed institutions rarely
publish data on the air cargo supply side. IATA publishes air cargo
supply data in its annual World Air Cargo Statistics (WATS). The data is
expressed in Available Cargo Tonne Kilometres (ACTK) by reporting
airline and is divided into international and domestic ACTK, and
scheduled, charter and all cargo operations. ACTK is compared towards
CTK to determine the weight load factor. Another way of measuring air
cargo supply is by calculating the Available Cargo Tonnes (ACT). ACT
considers the available capacity of a flight regardless of the distance
of this flight. Due to the scope of this research, the ACT capacity is
preferred as the focus is on weight parameters rather than
weight-kilometre parameters.
One problem with ACT data is the need for more publicly available
data. To solve this problem, data from flight traffic websites were
collected and processed to build a comprehensive database. The
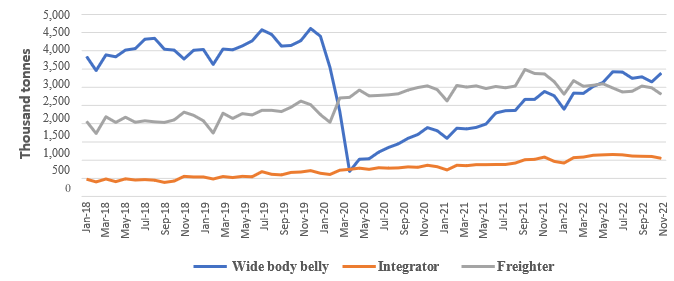
methodology can be found in section 3.2. Figure 5 illustrates the ACT on
an international level, divided into wide-body belly capacity, dedicated
freighter capacity, and integrator capacity. The data reveal that in
2019 around 59% of the capacity can be allocated to wide-body belly
capacity on international traffic. This allocation is higher compared to
the 50% market share on an industry level published by Boeing. This
would indicate that freighter and integrator capacity have a higher
domestic market share than international levels. Indeed, when domestic
data is included in the equation, the 59% wide-body capacity decreases
to a market share of 51%, relatively close to the market share published
by Boeing. The reason for the lower market share for wide-body on an
international level compared to a domestic level is twofold. First, the
data show that in 2019 54% of integrator data was dedicated to domestic
flights increasing the overall freighter capacity on the domestic
markets. Second, Anchorage is one of the world’s largest airports for
in-transit flights, connecting Asia with North America. Because
Anchorage is part of the United States, many freighter flights
connecting Anchorage with other United States airports are counted as
domestic flights.
Figure 5: International available cargo tonne evolution for
belly, integrator and freight capacity.
Figure 5 illustrates the impact of the COVID-19
pandemic on the air cargo market. Due to the travel restrictions,
wide-body belly capacity plummeted to around 700,000 ACT in April 2020.
Since 2021, wide-body passenger capacity started its slow recovery
process. In December 2022, the international wide-body belly capacity is
still 36% under 2019 levels. Freighter capacity and, to a lesser extent,
integrator capacity started increasing after March 2020 to substitute
the declining wide-body belly capacity. In 2022, freighter and
integrator capacity accounted for 57% of international ACT. Although the
current methodology provides us with some interesting data, it has three
main areas for improvement. First, the narrow-body freighter and
narrow-body passenger aircraft should be included in Figure 5. Although narrow-body aircraft
generally operate on domestic routes in larger countries like the United
States or Australia, in Europe and certain parts of Asia, narrow-body
aircraft operate cross-border flights. Second, preighter aircraft data
is currently included as wide-body belly capacity. Although preighter
flights did not occur in 2018 and 2019, IATA and Boeing’s data show a
10% market share of preighter aircraft in 2020, with peaks up to a
market share of 25% in May 2020. As of 2022, preighter flights accounted
for a market share of 5%. Last, the aircraft payload data used in the
current methodology is based on maximum payload figures. The maximum
payload is seldom reached as multiple factors, like flight distance,
airport elevation, jet stream, etc., can influence the payload. Using a
maximum payload, the data and results are subject to overestimation.
Indeed, when dividing the international cargo tonnes carried by the
international available cargo tonnes for the 2019 data, a load factor of
48.8% was found. This load factor is lower than the 50.4% indicated by
IATA, indicating an overestimation of the international ACT as demand
data for both calculations is the same.
4.3 Combining Demand and supply on
an international level
The above two components, demand and supply, were discussed
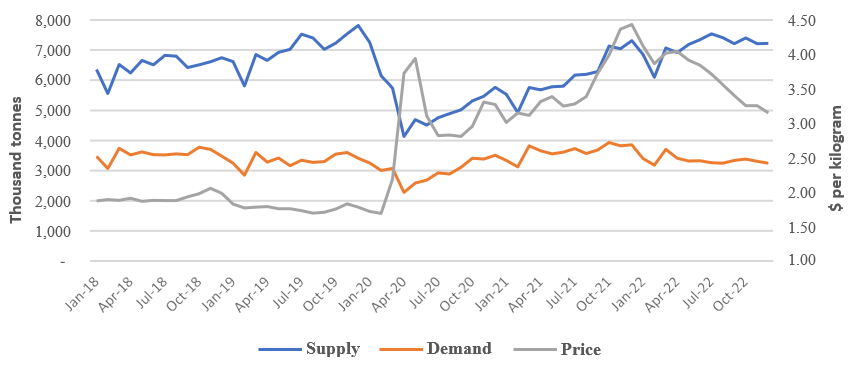
separately. Figure 6 shows those components combined with
air cargo rates provided by the World_ACD from January 2018 until
December 2022. Both demand and supply are expressed in cargo tonnes,
including double counting due to transfers, while the air cargo rates
are expressed in a price per kilogram chargeable weight. In 2019, the
international air cargo demand decreased by around 5% compared to 2018.
Due to the air passenger growth in the first two years, wide- body belly
capacity increased. Next to the wide-body belly capacity, the freighter
and integrator capacity also expanded on the international market.
Despite the decrease in air cargo demand, the increase of freighters and
integrators on an international level can be explained due to the
decline in domestic demand, making international routes more profitable
than domestic routes. The same happened in the following years, where
the freighter and integrator share on the international routes increased
while it decreased on the domestic routes. The increased supply and
decreased demand caused air cargo rates to decline on an international
level between January 2018 and December 2019. Since the outbreak of the
COVID-19 Pandemic, air cargo supply has plummeted due to the grounding
of wide-body belly capacity.
Over the last three years, the air cargo supply almost recovered to
pre-COVID-19 levels. As Figure 5 illustrates,
supply recovery is more due to additional freighter and integrator
capacity in the market than the wide-body belly capacity recovery.
Although the COVID-19 pandemic impacted air cargo demand, the impact was
relatively small, and the demand recovered quickly, reaching a
record-breaking year in 2021. The Ukraine-Russian war and the subsequent
economic recession caused air cargo demand to decrease in 2022. After
air cargo rates almost tripled in April 2020, they declined to double
the pre-COVID-19 rate around the summer of 2020 nearly. Between the
summer of 2020 and 2021, air cargo rates stabilised as demand and supply
increased. In the last three months of 2021, air cargo rates increased
from around $3.2 per kilogram to around $4.4 per kilogram. As air cargo
supply increased significantly more than air cargo demand, air cargo
rates were expected to decrease. The reason they grew rather than fell
can be found in the supply chain issues on the pacific trade lines,
where demand increased, and supply could not keep up. This problem
resulted in rates of above $15 per kilogram on some routes. Because of
the significant size of those trade lines, the exceptionally high rates
can also be found in the international air cargo rate data, which is a
weighted average of the individual market trade lines. Since the start
of 2022, air cargo rates have decreased to around $3.2 per kilogram at
the end of 2022.
Figure 6: An air cargo supply, demand and price evolution
from January 2018 until December 2022.
5 Disaggregated main trade line
market analysis
This section will discuss air cargo market imbalances between eleven
pre-defined regions. The imbalances are both estimated and discussed for
the demand and supply sides. The demand imbalances are estimated based
on sales tonnes rather than actually carried tonnes. This way, transfer
and in-transit data are excluded revealing the actual origins and final
destinations of air cargo flows. The supply imbalances are estimated for
the three types of supply: wide-body belly, freighter, and integrator
capacity. Afterwards, both the demand and supply imbalances are
compared.
5.1 Air cargo demand imbalances on
a region-to-region level
Regarding air cargo demand imbalances, Boeing provides carried tonnes
data between regions in their bi-annual world air cargo forecasts. IATA
provides CTK data in its IATA WATS or its online published reports. Both
data types have been discussed by the institutions (Boeing, 2022) and in
the literature (Morrell and Klein, 2019). Air cargo sales tonnes between
regions have yet to be analysed and discussed. The benefit of studying
air cargo sales tonnes is that it does not include double counting due
to transfers. It shows the first origin of the cargo and its final
destination. By excluding double counting, one can better analyse
whether a region is an importing, exporting or balanced air cargo
region. Double counting may blur the image and hides the actual cargo
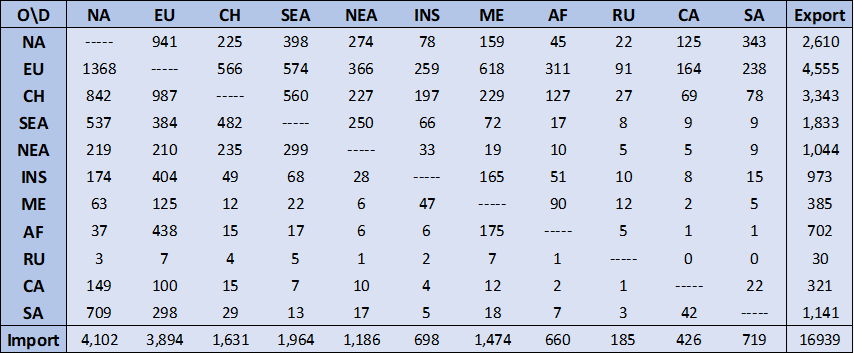
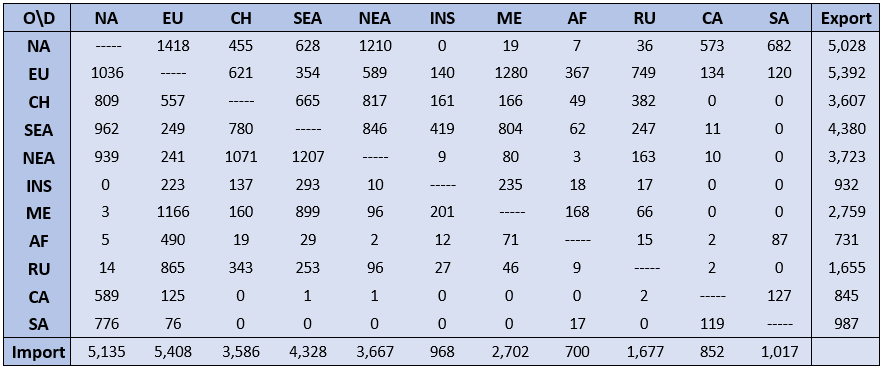
flows. For example, as Figure 7 indicates,
78,000 tonnes of air cargo originating in China and finding their final
destination in South America were sold in 2022. This 78,000 tonnes of
cargo is enough to fill 780 B777F flights with maximum payload,
indicating the significance of this route. When looking at actual
carried tonnes, traffic between China and South America is not found as
the flight distance is too far.
Figure 7 provides a matrix of the eleven
defined regions and the sales tonnes of cargo sold in 2022 between those
regions; the importance of the Northern Hemisphere trade lines can be
seen. The most extensive air cargo trade lines are between Europe and
North America, followed by China to Europe and China to North America.
The fifth biggest trade line, South America to North America, may be
surprising. This trade line is characterised by perishable cargo, mainly
fruit and vegetables. Europe is the leading exporting region, with an
export of 4.56 million tonnes of export cargo. North America is the most
extensive importing region, with 4.10 million tonnes of imported cargo.
China is a typical export market as its export is more than double its
import. China is a production country importing raw materials by sea
trade and exporting intermediate or finished products. On the other
side, the Middle East can be considered an importing region with an
import of 1.47 million tonnes compared to its export of 0.39 million
tonnes.
Overview of sales tonnes transported between the studied
regions in 2022 (thousand tons).
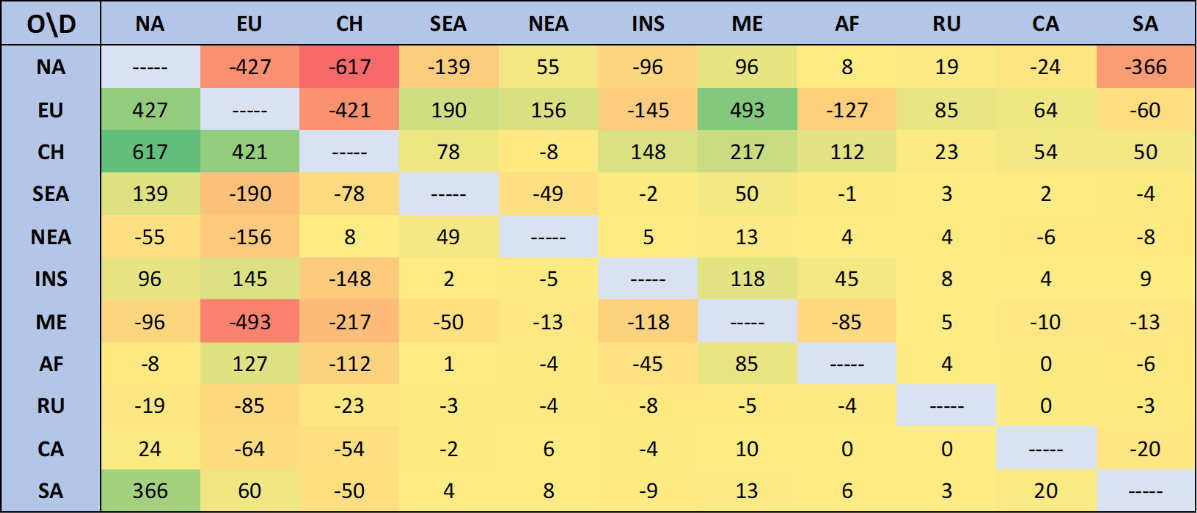
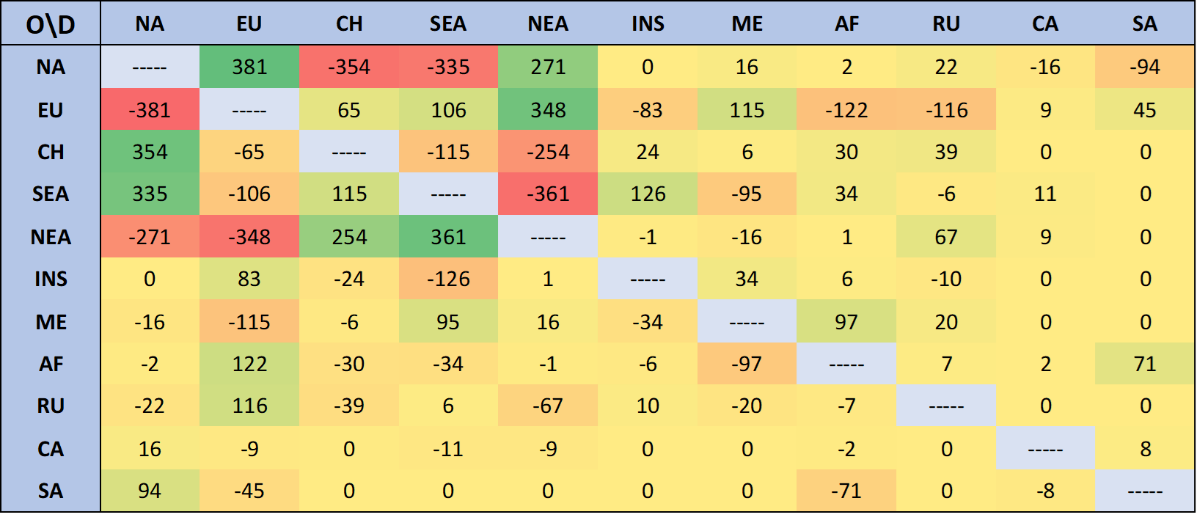
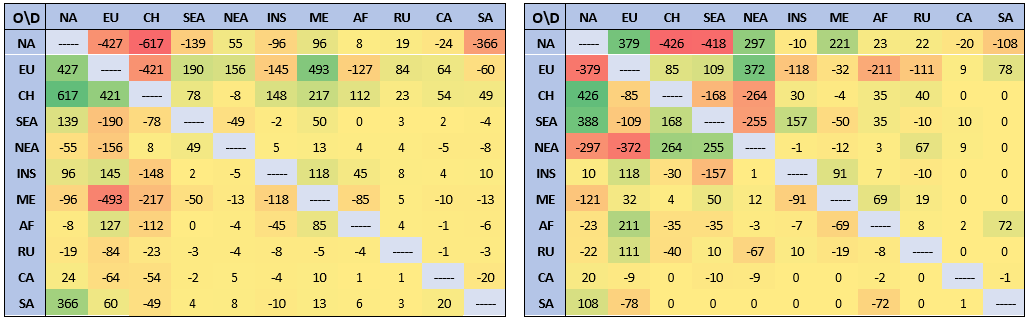
Regarding trade imbalances, Figure 8 gives an
overview of the imbalances in absolute terms between the different
regions. Around half of the trade lines are imbalanced markets with an
imbalance larger than 50,000 tonnes. The region pair with the most
significant imbalance is the China - North America route, with an
imbalance of 617,000 tonnes. China’s export to North America is 617,000
tonnes higher than its import from North America. Other highly
imbalanced routes are Europe – North America, Europe – Middle East,
China – Europe, and South America – North America Routes. The total
imbalance between export and import does not have to be the same for all
its exporting and importing regions. Europe, for example, has a positive
trade weight balance with North America, meaning that Europe’s air
export volumes to North America are higher than its import volumes.
While Europe has a positive trade weight balance with the Middle East,
Southeast Asia, and Northeast Asia, it has a negative trade weight
balance with China, the Indian Sub-Continent, and Africa. Another region
with both positive and negative trade weight balances is the Indian
Sub-Continent which has a positive trade weight imbalance with Europe,
North America, and the Middle East but a negative trade imbalance with
China. Generally, most regions are characterised by either a negative or
a positive trade weight imbalance. For example, China has a positive
trade imbalance for almost all its routes, while the Middle East and
North America have a negative trade imbalance.
Overview of the sales tonnes imbalances between the studied
regions in 2022 (thousand tons).
5.2 Air cargo supply imbalances on
a region-to-region level
5.2.1 Air cargo supply imbalances
for the freighter network
Air cargo supply imbalances have been studied by Bombelli et al.
(2020), who analysed the air cargo supply network. They mainly focused
on origin-destination pairs on an airport-to-airport level. The main
contribution of the next section will be the allocation between
freighter, integrators and wide-body belly capacity, and on the
region-to-region rather than the airport-to-airport approach. The data
used in this section is from 2022 and was collected from flight tracking
websites. It includes both wide-body passenger and freighter aircraft
and narrow- body freighter aircraft. Further information on the
methodology can be found in Section 3.
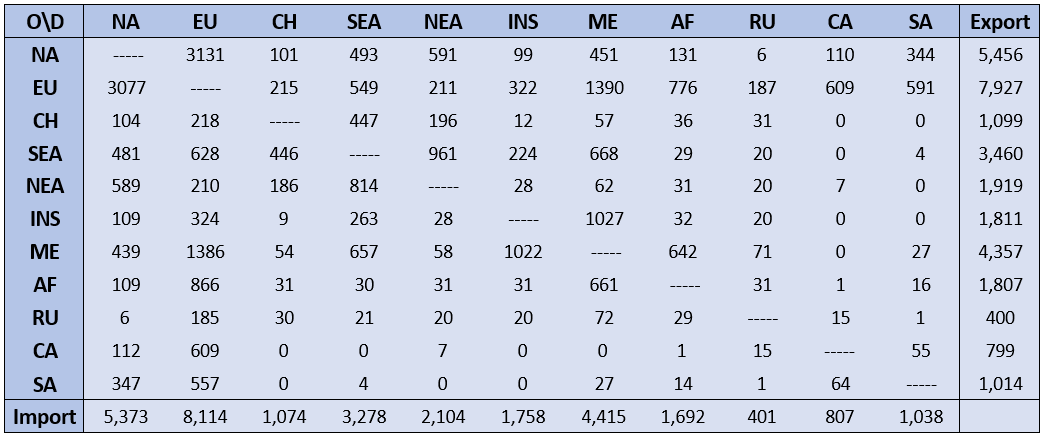
The freighter network is the most imbalanced one of the three studied
types. Figure 9 gives an overview of the ACT between
the studied regions. Compared to the air cargo demand, air cargo supply
inbound has to be equal or almost equal to outbound. This is not the
case for air cargo demand, as the load factor of the aircraft is
different on different trade lines. As Figure 9 indicates,
there is some variation between the inbound and outbound capacity of the
same region. The data assumes the maximum payload of each aircraft type
without considering other factors like flight distance, weather
conditions, airport elevation, etc., which can impact the payload. The
reason for those imperfections can be found in the data of the flight
tracking website themselves and the incompleteness of specific data
points causing flights to be deleted in the cleaning process. Routes
with a high freighter capacity are generally considered routes with a
low wide-body belly capacity or a high air cargo demand. As for air
cargo demand data, freighter aircraft data shows that air cargo is
mainly a Northern Hemisphere business.
Overview of the freighter capacity between the studied
regions in 2022 (thousand tons).
Figure 10 illustrates the freighter imbalances
between different regions. The biggest imbalances are between North
America – Europe, Southeast Asia – North America, China – North America,
Europe – Northeast Asia, and Northeast Asia – Southeast Asia. Those
imbalances are generally between the main three air cargo regions;
Europe, North America and Asia. As is not the case for air cargo demand,
those imbalanced regions cancel each other out as inbound aircraft
capacity should be the same as outbound capacity. Figure 11 illustrates the imbalances which are
higher than 50,000 tonnes. Some potential triangular or multisector
flight sectors can be found based on those imbalances. The main
potential sectors are CN-NA-NEA-CN, NEA-RU-EU-NEA, EU-ME-AF-EU,
EU-ME-AF-SA-NA-EU, SEA-INS- EU-SEA, and EU-CN-NA-EU as can be seen on
Figure7. In-depth database analysis is needed to identify the actual
sectors’ flow and how often they are operated.
Overview of the freighter capacity imbalances between the
studied regions in 2022 (thousand tons). Overview of the top 20 most imbalanced routes based on
freighter capacity in 2022.
5.2.2 Air cargo supply imbalances
for the integrator network
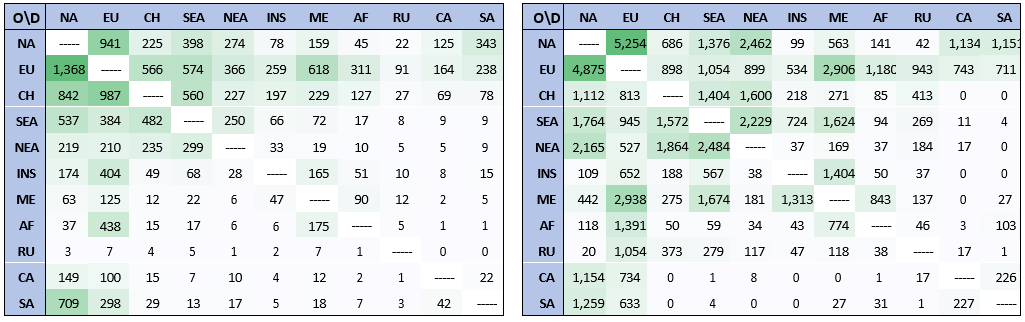
The integrator capacity is generally less imbalanced than the
freighter capacity but more imbalanced than the wide-body belly
capacity. Integrator traffic is even more northern hemisphere focused
than its freighter counterpart. When observing Figure 12, one might notice a 100,000 tonnes
imbalance between Southeast Asia’s outbound and inbound capacity.
Although general gaps are explained due to cleaning, data provision, and
processing errors, a 100,000 gap on an average-size route is
exceptional. A more in-depth database analysis is required to understand
better what type of error causes a gap of around 7.5% in the data.
When it comes to imbalances, Figure 12 indicates
an unusual imbalance between North America and the Middle East. No
records were found for flights from the Middle East to North America.
This is unsurprising as the Middle East is generally an import region,
importing high- end products from developed regions like North America.
The same imbalance can be found between Southeast Asia and the Middle
East and between the Indian Sub-Continent and the Middle East. From the
Middle East, the excess capacity flies to Europe to be redistributed to
North America or Southeast Asia. Another significant imbalance exists
between North America and China/Southeast Asia. This imbalance also
occurred on the freighter network. At the same time, the imbalance
between North America and Northeast Asia is more minor but also in the
other direction, from North America to Northeast Asia.
Overview of the integrator capacity between the studied
regions in 2022 (thousand tons).
5.2.3 Air cargo supply imbalances
for the wide-body belly network
The air cargo wide-body belly capacity is generally balanced between
the trade lines. Although aircraft generally operate both legs of an
origin-destination pair, this is not always the case. Sometimes airlines
perform one leg with an A350-900 aircraft and the other with a B777-
300ER. Both aircraft have another air cargo belly-hold payload causing
inconsistencies in the data. The reason airlines often switch aircraft
on both legs of the same route can be twofold. First, on a long-haul
flight, due to the jet stream, the flight time on one leg can be up to
two hours longer than the flight time on the other leg. The two-hour
longer flight leg requires a higher payload for fuel resulting in a
lower payload for cargo in the belly hold. Airlines can optimise their
air cargo operations by using more cargo-friendly or more efficient
aircraft on highly cargo-imbalanced routes. Due to the imperfection and
data aggregation, it is unclear on which routes and how often those
switches happen. Further research into the database is needed to analyse
how often a different aircraft is used on one leg compared to the return
leg. Also, more research on the reason behind those switches is needed.
Although it is difficult to say which routes are imbalanced due to those
aircraft switches, two region-to-region combinations stand out. First,
the Europe to Southeast Asia route has an ACT of 549,000 tonnes, while
the Southeast Asia to Europe route has a payload of 628,000 tonnes.
Second, the Europe to Africa route has a payload of 776,000 tonnes
compared to the 866,000 tonnes on Africa to Europe route.
Overview of the wide-body belly capacity between the
studied regions in 2022 (thousand tons).
5.3 Comparison of air cargo supply
and demand imbalances
As discussed above, both air cargo demand and supply are imbalanced
between regions. Comparing sales tonnes demand imbalances with available
cargo tonnes imbalances is useful for two reasons. First, while a
region’s total inbound and outbound are not equal for air cargo demand,
they should be similar for air cargo supply. Aircraft entering a region
either keep flying in the region or leave the region, meaning that their
inbound and outbound capacity should be equal considering the usage of
the aircraft’s maximum cargo payload. The difference between inbound and
outbound may cause disparities in the market. Second, by observing the
sales tonnes rather than the carried tonnes, transfer data and double
counting are excluded from the comparison. By excluding the transfer
data, it is possible to get an indication of the transfer and in-transit
region on a global market. Although the comparison may give a valuable
indication, more research is needed on integrator express data as it is
excluded from the demand side but included in the supply side.
Currently, there is no publicly available information on how much cargo
and express integrators carry and between which markets. Furthermore,
more in-depth research is needed to estimate how many transfers are
taking place and where they are happening. This requires a significant
amount of detailed data, which is, to our best knowledge, yet to become
available for academic research. Based on the sales tonnes data we
received and the capacity database we built, we derived which regions
are transfer or in transit regions. However, it will be challenging due
to the above-described reasons.
Figure 14 compares the total sales tonnes and
total available capacity between regions for 2022. Based on this
comparison, some interesting aspects can be found. First, the Russian
and Central Asia region has low import and export tonnes but high ACT.
Transits can explain the high supply flows but low demand flows. Many
airlines land at airports in Central Asian countries to refuel, as jet
fuel is relatively cheap. The four main countries where aircraft might
refuel are Azerbaijan, Kazakhstan, Kyrgyzstan and Uzbekistan. Those four
countries accounted for 32% of the inbound originating from and outbound
to Europe, East Asia and China in 2019. Those three regions are the
three main regions flying to and from Central Asia. The 32% represents
around 615,000 ACT and might seem small as it only accounts for
one-third. The other country that accounts for 61% of traffic from and
to those three regions is Russia. Although there is quite some capacity
entering and leaving Russia, the Russian air cargo demand better matches
this capacity. At the same time, this is not true for the four countries
indicating their position as refueling hubs for cargo aircraft. Due to
the Russian-Ukraine war, the role of those refueling hubs increased as
certain European and Asian carriers could no longer enter Russian
airspace. Indeed, when looking at the traffic, the data indicates a
supply increase from 32% to 74% for those four countries or an increase
from 615,000 ACT to 1,310,000 ACT. In comparison, the Russian share
decreased from 61% to 21%, following the decrease in air cargo demand
from and to Russia. By refueling, they can increase their air cargo
payload, switch crew, and offer a broader range of farther destinations.
Second, compared to its air cargo demand, the ACT of the Middle East and
Northeast Asia are relatively high. This is not surprising as the Middle
East is an air cargo and air passenger transfer region, and Northeast
Asia is both a transfer and transit area for air cargo. While the Middle
East connects Asia with Europe, Northeast Asia connects the other Asian
regions with the United States. Another transit region is Central
America, connecting South America with North America and Europe and Asia
through North America. Conversely, the China and South American outbound
routes seem congested. Based on those tables, both ways have the highest
load factor of around 55% on average, indicating that those regions are
unsuitable as transfer regions due to high demand and low supply.
Another observation indicates some region pairs to be partly or
completely dependent on transfer or transit routes. Some clear examples
of region pairs completely dependent are China to Central and South
America and the other way around. Region pairs with direct capacity, but
where the comparison indicate they are partly reliant on transfer or in
transit flights are Indian Sub-Continent to North America, China to
Europe and China to Africa. Those region combinations are not a surprise
due to their long flight distances. Future research is required to look
more in-depth at some region-to-region pairs, as region-to-region
comparisons might be aggregated. For example, a lot of in-transit
traffic happens in ANC, which currently needs to be shown in the
region-to-region matrices.
Comparison between sales tonnes (left) and total available
capacity (right) between the studies regions for 2022 (thousand tons).
Regarding region-to-region imbalances, some observations can also be
made. Figure 15 gives an overview of both the sales
tonnes imbalances and the ACT imbalances between regions for 2022; it
indicates a significant demand imbalance between North America and
Europe for both demand and supply. While the demand imbalance is
negative for outbound of North America, the supply imbalance is
positive. This indicates that although there is more demand from Europe
to North America than from North America to Europe, there is lesser
supply. This observation goes in against the general assumption that
supply follows demand. Of course, this assumption still holds as the
reason for this phenomenon is not due to airlines deliberately planning
those mistakes, but it has rather to do with the significant demand
imbalance North America has. A significant amount of supply is coming
from Asia and Europe to North America. All this supply is left in North
America and there is not enough demand due to the large demand imbalance
to fly back. Many airlines are rather flying from Asia to North America
to Europe and then back to Asia than flying from Asia to North America
and back. This has a significant impact on the air cargo rates in the
North America to Europe market, a market already dominated by wide-body
capacity and negative trade imbalances.
Another region-to-region pair with the same problem but to a lesser
extent is the China-to-Europe, China-to-Southeast Asia and to a lesser
extent China-to-Middle East routes, where there is a positive demand
imbalance for China’s outbound, but a negative supply imbalance. China
has a lot of outbound demand but significantly less inbound demand. Due
to the equal inbound and outbound supply, airlines have to choose which
routes they would rather serve and which routes they would fly empty or
with a lower payload. In general, airlines choose to operate
China-to-North America routes, which is a highly profitable route,
rather than allocating their capacity to China to Europe, China to
Southeast Asia and China to Northeast Asia routes.
Comparison between sales tonnes imbalances (left) and total
available capacity imbalances (right) for the studied region in 2022
(thousand tons).
6 Conclusions and limitations
One of the main shortcomings in air cargo market research is the lack
of comprehensive data for academics. Although aggregated and, to a
lesser extent, disaggregated data are published by large institutions,
one needs to consider the methodology to find out what data is included
or excluded as differences between datasets occur. Most market data
publicly available is published by IATA, but also Boeing and ICAO
publish data. The data is generally expressed in FTK, CTK, ACTK and RTK.
All measures include both weight and distance. The available data is
more limited regarding cargo tonne or available cargo tonne data and is
often not comparable or different. This paper introduces two new types
of air cargo market data. The first type is the sales tonnes. The sales
tonnes are the tonnes sold from an origin to its final destination
without double counting due to transfer data. This data type is
especially interesting when observing country or region imports and
exports as this data is generally hidden in the carried tonnes data. The
second type is ACT data collected from flight tracking websites. A
comprehensive database was built for five consecutive years, from
January 2018 to December 2022. The data was collected from three
different sources, which did not happen before.
Next to providing this new data, the data is used and tested in
calculating air cargo market imbalances between eleven defined regions.
Although air cargo demand and supply imbalances are not new and have
been proven previously, the main contribution of this research is the
usage of sales tonnes rather than actual tonnes as used by Boeing, a
region-to-region complete market overview for the air cargo supply, and
a comparison between directional demand and supply.
While large negative export imbalances were found for North America
and the Middle East, a large positive export imbalance was found for
China. All those regions, together with Russia and Central Asia, are
dominated by either larger import or export air cargo volumes. For the
remaining regions, the imbalances depend on the corresponding region.
For air cargo supply, large imbalances were found for the freighter
networks, limited imbalances for the wide-body belly capacity networks
and medium imbalances for the integrator networks. Regarding the
freighter network, large imbalances were found between the three main
continents: North America, Europe, and Asia. By comparing air cargo
demand and supply on a region-to-region level, it became clear that
Northeast Asia, Russia and Central Asia, the Middle East, and Central
America are all transfer or in-transit regions with a large amount of
air cargo throughput. For the other regions, it is unclear whether they
are transfer, in-transit or importing regions. Although the general
assumption of air cargo supply following air cargo demand holds, it does
not necessarily mean that the imbalances between demand and supply are
the same for all region pairs. A good example can be found on the Europe
– North America trade line where the demand imbalance is on the opposite
leg than the air cargo supply imbalance. This phenomenon is explained by
an excess air cargo supply, causing aircraft originating from Asia to
fly back via the European mainland. Although comparing air cargo demand
with air cargo supply can provide a first indication of certain market
dynamics, a more in-depth research is required to understand the market
dynamics better. Although there is a lack of integrator express data and
a shortage of more disaggregated carried tonnes data, those two datasets
are required to understand the complete market better.
Although the large extent and significant level of detail, the
database has some shortcomings. First, the database assumes the maximum
payload per aircraft type to estimate the ACT. By doing this, the
database is guaranteed to be an overestimation of reality, as the
maximum payload of an aircraft is seldom available. Second, the database
excludes narrow-body passenger aircraft in all years and narrow-body
freighter aircraft for the first four years. Last, due to missing
flights on flight tracking websites and incomplete flight information,
the cleaning progress filters out around 5% of all data causing
imperfections in the dataset. To the best of our knowledge, this is the
first work that introduces air cargo sales tonnes data and builds a
comprehensive database based on three different flight tracking
websites. As such, the data and insights could be extended and used in
many ways. As airlines build their network on origin to final
destination flows and utilise their hub and assets accordingly in
providing capacity, the actual flow data is rather an aggregated outcome
of cargo network decisions made by all airlines. For this reason, we
believe that providing sales tonnes data rather than actual flow data
will help managers, salespeople, network planners, etc., better to
understand the origin and final destination of those flows in order to
improve their decision-making. Although comparing actual flow data might
be better suited, comparing sales tonnes data with the available
capacity might provide decision-makers with a better understanding of
which routes are over and underserved to adjust their capacity
accordingly. Further research on actual flow data compared with sales
tonnes data and the available capacity data might be desired to analyse
the air cargo network and its flows.
Providing the availability of actual flown demand data, our sales
tonnes data could be compared with the actual flown data to better
understand the role of double-counting, transfers, and in-transit
flights. Overall, the data allows for more future research on air cargo
market dynamics of demand and supply on a more disaggregated level.
Individual airline networks could be reconstructed, impacts, such as the
Russian-Ukraine war, on certain airports or regions could be better
isolated and analysed, evolutions in the market could be quantified,
etc. Providing air cargo price data availability, the relationship
between air cargo demand, supply and pricing could be better quantified.
The impact of over- and under-capacity in the market on the price levels
and route development might lead to a better understanding of the
behaviour of airlines towards profit maximisation or decision-making.
Another interesting research direction would be air cargo forecasting
models. As current air cargo forecasting is mainly done on actual flow
demand rather than sold demand, it might be an interesting perspective
to forecast future sold demand and identify how the current networks
need to be adapted. Next to air cargo forecasting, an integrated air
cargo forecasting model for demand, supply, and price might be
especially interesting for airline managers in allocating their assets,
supporting them with network development problems, and making decisions
on whether to buy or sell aircraft.
References
Alexander, D., & Merkert, R. (2021). Applications of gravity
models to evaluate and forecast US international air freight markets
post- GFC. Transport Policy, 104, 52–62. https://doi.org/10.1016/j.tranpol.2020.04.004
Alıcı, A., & Akar, A. S. (2020). Macroeconomic determinants of
air cargo demand: A panel data analysis. Transport & Logistics: The
International Journal, 20(48).
Amaruchkul, K., Cooper, W. L. & Gupta, D. (2010). A Note on
Air-Cargo Capacity Contracts. Production and Operations Management,
20(1), 152–162. https://doi.org/10.1111/j.1937-5956.2010.01158.x
Baier, F., Berster, P., & Gelhausen, M. (2021). Global cargo
gravitation model: airports matter for forecasts. International
Economics and Economic Policy, 19(1), 219–238.
https://doi.org/10.1007/s10368-021-00525-2
Boeing. (2010-2022). World Air Cargo Forecast (Various Editions)
Bombelli, A. (2020). Integrators’ global networks: A topology
analysis with insights into the effect of the COVID-19 pandemic. Journal
of Transport Geography, 87, 102815.
https://doi.org/10.1016/j.jtrangeo.2020.102815
Bombelli, A., Santos, B. F., & Tavasszy, L. (2020). Analysis of
the air cargo transport network using a complex network theory
perspective. Transportation Research Part E: Logistics and
Transportation Review, 138, 101959.
https://doi.org/10.1016/j.tre.2020.101959
Boos, F. (2015). Challenges and Opportunities in Airfreight. Lecture
at the Air Transport Colloquium. University of Antwerp, Antwerp. 3rd
December 2015.
Bowen, J. R. (2012). A spatial analysis of FedEx and UPS: hubs,
spokes, and network structure. Journal of Transport Geography,
24, 419–431. https://doi.org/10.1016/j.jtrangeo.2012.04.017
Budd, L., & Ison, S. (2017). The role of dedicated freighter
aircraft in the provision of global airfreight services. Journal of Air
Transport Management, 61, 34–40.
https://doi.org/10.1016/j.jairtraman.2016.06.003
Chao, C. C., & Li, R. G. (2017). Effects of cargo types and load
efficiency on airline cargo revenues. Journal of Air Transport
Management, 61, 26–33.
https://doi.org/10.1016/j.jairtraman.2015.11.006
Feng, B., Li, Y., & Shen, Z. J. M. (2015). Air cargo operations:
Literature review and comparison with practices. Transportation Research
Part C: Emerging Technologies, 56, 263–280.
https://doi.org/10.1016/j.trc.2015.03.028
Gangwani, K. (2015). Freighter operators still confident despite
belly hold cargo surge. Air Cargo News, 3.
Gong, Q., Wang, K., Fan, X., Fu, X., & Xiao, Y. (2017).
International trade drivers and freight network analysis - The case of
the Chinese air cargo sector. Journal of Transport Geography,
71, 253–262. https://doi.org/10.1016/j.jtrangeo.2017.02.009
Grin, B. (1998). Developments in Air Cargo. Handbook of Airline
Marketing, McGraw-Hill Verlag, 75-93.
Heinitz, F., & Meincke, P. (2013). Modeling Framework of Origin
and Destination Air Cargo Routing. Transportation Research
Record, 2336(1), 83–90. https://doi.org/10.3141/2336-10
Holloway, S. (2008). Straight and Level: Practical Airline Economics.
Routledge. IAG. (2023). fleet. IAG Cargo. https://www.iagcargo.com/en/fleet/
Kasarda, J. D., & Green, J. D. (2005). Air cargo as an economic
development engine: A note on opportunities and constraints. Journal of
Air Transport Management, 11(6), 459–462. https://doi.org/10.1016/j.jairtraman.2005.06.002
Kupfer, F., Meersman, H., Onghena, E., & Van De Voorde, E.
(2011). World air cargo and merchandise trade. Critical issues in air
transport economics and business / Macário, Rosário
[edit.]; et al., 98–111.
Kupfer, F., Meersman, H., Onghena, E., & Van de Voorde, E.
(2012). Air freight and merchandise trade: towards a disaggregated
analysis. Journal of Air Transport Studies, 2(2), 28–48.
https://doi.org/10.38008/jats.v2i2.99
Kupfer, F., Meersman, H., Onghena, E., & Van de Voorde, E.
(2017). The underlying drivers and future development of air cargo.
Journal of Air Transport Management, 61, 6–14. https://doi.org/10.1016/j.jairtraman.2016.07.002
Lakew, P. A. (2014). Economies of traffic density and scale in the
integrated air cargo industry: The cost structures of FedEx Express and
UPS Airlines. Journal of Air Transport Management, 35,
29–38. https://doi.org/10.1016/j.jairtraman.2013.11.001
Lakew, P. A., & Tok, Y. C. A. (2015). Determinants of air cargo
traffic in California. Transportation Research Part A: Policy and
Practice, 80, 134–150. https://doi.org/10.1016/j.tra.2015.07.005
Li, Z., Bookbinder, J. H. & Elhedhli, S. (2012). Optimal shipment
decisions for an airfreight forwarder: Formulation and solution methods.
Transportation Research Part C: Emerging Technologies, 21(1), 17–30.
https://doi.org/10.1016/j.trc.2011.08.001
Macário, R., & Van de Voorde, E. (2022). Economic structure of
the air transport business. The Air Transportation Industry, 1–25.
https://doi.org/10.1016/b978-0-323-91522-9.00001-4
Malighetti, P., Martini, G., Redondi, R., & Scotti, D. (2019a).
Air transport networks of global integrators in the more liberalised
Asian air cargo industry. Transport Policy, 80, 12–23. https://doi.org/10.1016/j.tranpol.2019.04.021
Malighetti, P., Martini, G., Redondi, R., & Scotti, D. (2019b).
Integrators’ Air Transport Networks in Europe. Networks and Spatial
Economics, 19(2), 557–581. https://doi.org/10.1007/s11067-018-9390-5
Merkert, R., & Ploix, B. (2014). The impact of terminal
re-organisation on belly-hold freight operation chains at airports.
Journal of Air Transport Management, 36, 78–84.
https://doi.org/10.1016/j.jairtraman.2014.01.003
Morrell, P. S., & Klein, T. (2018). Moving Boxes by Air: The
Economics of International Air Cargo.
Rodrigue, J. (2006). Challenging the Derived Transport-Demand Thesis:
Geographical Issues in Freight Distribution. Environment and
Planning A, 38(8), 1449–1462.
https://doi.org/10.1068/a38117
Shaw, S. (2016). Airline Marketing and Management. Taylor &
Francis.
Song, M., & Yeo, G. (2017). Analysis of the Air Transport Network
Characteristics of Major Airports. The asian journal of shipping and
logistics, 33(3), 117–125.
https://doi.org/10.1016/j.ajsl.2017.09.002
Wadud. (2013). Simultaneous Modeling of Passenger and Cargo Demand at
an Airport. Transportation Research Record, 2336(1), 63–74. https://doi.org/10.3141/2336-08
Wei, W. (2006). Exploration of Data Sources for Air Cargo Studies.
No. MTI WP07-01
World Bank. (2021 Air transport, freight (million tonne-km). The
World Bank Data. https://data.worldbank.org/indicator/IS.AIR.GOOD.
MT.K1
World Bank. (2022). Services, value added (% of GDP). The World Bank
Data. https://data.worldbank.org/indicator/NV.SRV.TOTL.ZS?
end=2021&start=1960
Yu, C., & Zou, L. (2022). Air Trade, Air Cargo Demand, and
Network Analysis: Case of the United States. Advances in Airline
Economics, 207–239. https://doi.org/10.1108/s2212-160920220000009009
Zhang, A., & Zhang, Y. (2002). A model of air cargo
liberalisation: passenger vs. all-cargo carriers. Transportation
Research Part E: Logistics and Transportation Review, 38(3–4), 175–191.
https://oi.org/10.1016/s1366-5545(02)00004-2